Saad Ullah

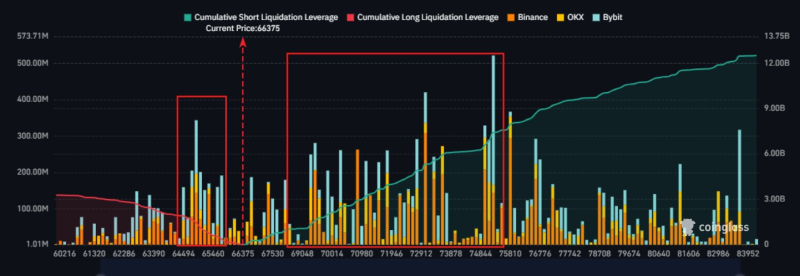
Bitcoin is sitting in a tightly defined liquidity structure, with the latest heatmap showing a significant buildup of short leverage above current price. The chart highlights a clear imbalance - one that could act as a magnet for price - while also leaving room for a move in the opposite direction before any expansion unfolds.
The BTC Liquidity Stack Building Above $75K and $83K
The chart shows cumulative short liquidation leverage steadily rising toward the $83,000 region, where roughly $12.5 billion in positions are clustered. This creates a dense overhead zone that stands out as the most significant concentration on the map.
As Crypto Seth noted, these levels represent areas that are likely to be grabbed over time, reflecting how liquidation clusters often become focal points in BTC technical analysis.
Liquidation clusters often become focal points for price - not because of prediction, but because positioning itself shapes where the market is drawn.
The structure is not isolated. A secondary liquidity band sits near $75,000, where approximately $7.45 billion in short exposure is accumulated - creating a layered setup rather than a single target, with multiple zones stacked above current price near $66,375.
A BTC Market Pulled Between Two Liquidity Pools
The chart reveals that pressure is not one-sided. While short liquidations dominate above, there is still visible long liquidation exposure below current levels - estimated around $2 billion. This creates a two-sided structure:
- Heavy short liquidity from $75K to $83K
- Smaller but present long liquidity below current price
- Current price positioned mid-range near $66K
- Repeated liquidation spikes across exchanges signaling active leverage
Bitcoin Drops Below $74K: Price Analysis Shows Liquidity Sweep shows how this kind of two-sided setup has played out in recent BTC history, where price swept downside liquidity before reversing toward the larger overhead pool.
Why the BTC $75K Zone Is Already in Play
The $75K zone stands out as the nearest major cluster and acts as an intermediate target within the broader structure. It represents a thick concentration of short exposure that sits closer to current price compared to the larger $83K pool - making it the more immediate focal point for any upside move.
Price tends to move step-by-step through liquidity clusters rather than jumping directly to the largest zone - $75K is the next logical stop before $83K comes into view.
Bitcoin Tests $83K-$85K Liquidity Zone After Monday's Flush documented a prior approach into the upper liquidity band, providing context for how BTC has behaved near these clusters in recent sessions. $4.34 Billion in Bitcoin Short Liquidations Could Trigger Major Squeeze reinforces the mechanics behind why these clusters matter - the larger the concentration, the more explosive the potential move when price finally reaches it.
The chart does not point to a fixed direction but rather a sequence of potential moves driven by positioning. Until one of these clusters is cleared, BTC remains inside a structure shaped less by trend and more by where leverage has accumulated.
 Saad Ullah