 Eseandre Mordi

⬤ West Texas Intermediate crude oil futures are showing signs of a structural shift after completing a clear five-wave decline on the microstructure. The pattern on Light Crude Oil (CL) charts suggests a larger B-wave may have topped, pointing toward a broader corrective phase ahead. The impulsive leg lower appears complete, which opens the door for a temporary rebound.
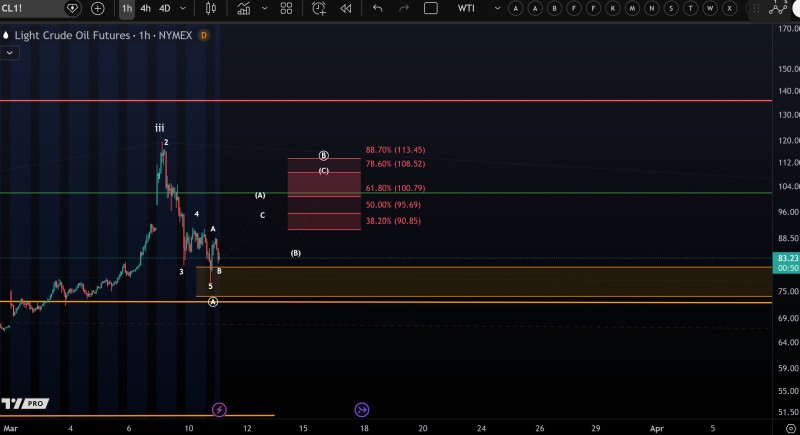
⬤ In Elliott Wave terms, a completed five-wave sequence to the downside typically precedes a corrective recovery. From current support, WTI may attempt a corrective wave B rebound. This kind of move reflects a temporary recovery within a larger bearish structure, not a confirmed trend reversal. As recent coverage showed in WTI Oil Price Analysis: Crude Breaks $65.39, Eyes $68-$69 Level, price action around key technical zones can shift momentum quickly.
⬤ Fibonacci retracement levels map out potential resistance at $90.85, $95.69, and $100.79, with the upper band reaching $108.52 and $113.45. A sustained close above $113.45 would shift the interpretation in favor of buyers. Until that happens, the base case remains a corrective bounce before another leg lower. This echoes the dynamics discussed in Oil Price News: WTI Falls Below $60 With Deeper Risks, where technical breaks accelerated selling pressure.
⬤ Corrective rebounds after extended declines are not unusual in crude markets. Oil Prices Jump 4.6% in January 2026 After Five-Month Slide illustrated exactly that dynamic: sentiment can reverse sharply once a structural low is in place. For WTI now, how price reacts around the major resistance cluster will determine whether the current rebound extends or fades into another corrective wave lower.
 Eseandre Mordi


