 Usman Salis

Crude oil is making headlines again after a sharp, aggressive rally pushed prices from the mid-$60s to above $110 in a remarkably short time frame. As noted by Crypto Rover, oil has posted its highest weekly close since mid-2022 - a milestone that signals a meaningful shift in market structure after years of sideways-to-down price action.
The move is drawing attention from analysts and traders alike, and for good reason. This isn't just a bounce - it's a structural shift.
Oil Breaks Out After Years of Consolidation
The chart tells a clear story. From 2023 through early 2026, crude oil spent most of its time grinding through a broad, directionless range - forming lower highs and repeatedly failing to hold rallies. That kind of prolonged compression tends to build liquidity beneath the surface.
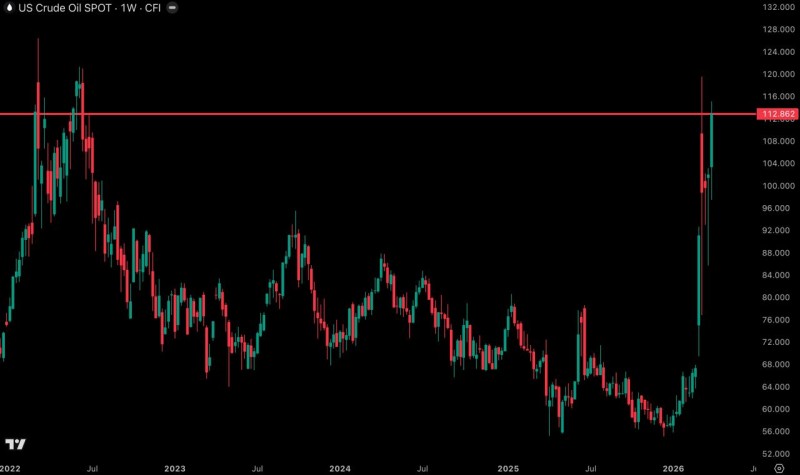
Price has now completed a full retracement of the entire multi-year decline structure in what appears to be a single impulsive leg higher.
When that liquidity finally released, it did so with force. The vertical move from the mid-$60 range to above $110 reflects exactly the kind of momentum expansion that typically follows extended consolidation phases. There were minimal pullbacks along the way, and bullish candles dominated the advance - a sign that buyers were firmly in control throughout the move.
Recent crude oil price analysis had already flagged key resistance levels on the way up, highlighting how these zones tend to define whether rallies develop into sustained trends or simply fade.
The $112-$113 Zone: Oil's Most Important Resistance Level
Here's where things get technically interesting. The rally has brought crude oil directly into the $112-$113 horizontal resistance zone - the same level that acted as a major rejection point during the 2022 cycle peak.
This zone previously capped the prior cycle high, and the market is now revisiting it after years of weaker structure - a setup that rarely goes unnoticed by technical traders.
For context, what makes this level significant isn't just that it stopped price before. It's that oil is now approaching it from a completely different structural position, having cleared the entire multi-year decline. That changes the dynamics of the test.
Key observations from the current chart setup:
- Price approached major resistance without meaningful consolidation along the way
- The rally retraces the full multi-year decline in one directional move
- The current zone aligns precisely with prior cycle rejection levels
Brent crude benchmarks have been tracking similar technical developments, reinforcing that broad oil market strength is not isolated to a single contract.
What Happens at $112 Will Define the Next Phase for Crude Oil
Oil now sits at a decisive crossroads, and the next reaction at this level matters.
If price holds above the $110-$113 region, it would confirm a breakout and open the door to continuation - potentially into uncharted territory above the 2022 highs.
If rejected, however, the move could transition into a period of consolidation or a pullback after the sharp advance. That would be a natural response to hitting historically significant supply.
Previous USOIL price setups have demonstrated exactly this dynamic - resistance levels acting as decisive turning points that either cap rallies or, when broken, trigger the next leg higher.
For now, the chart reflects a commodity market that has unambiguously regained momentum. The short-term structure is bullish. But the market is also staring at the same ceiling that defined its last cycle peak - and how it responds to that level will tell traders everything they need to know about what comes next.
 Usman Salis


