 Usman Salis

Natural gas is treading water as buyers struggle to push price past a cluster of resistance levels that have been rejecting rallies for weeks. Trading near $3.15, the commodity looks stable on the surface, but the technical picture tells a more cautious story.
Price action recently attempted to break above a dotted resistance line and invalidate a bearish flag structure. The attempt failed. No daily close above that level has materialized, keeping bullish momentum firmly in check and reinforcing the idea that this market is not ready for a sustained move higher.
50-Day and 200-Day EMAs Cap Every Rally
The bigger obstacle is the overhead moving average zone. NATGAS is trading well below both the 50-day EMA near $3.68 and the 200-day EMA around $3.64. These levels are not just resistance, they are dynamic ceilings that have consistently rejected upside attempts. Price is also forming a rising wedge after the recent selloff, which typically signals consolidation rather than a true reversal.
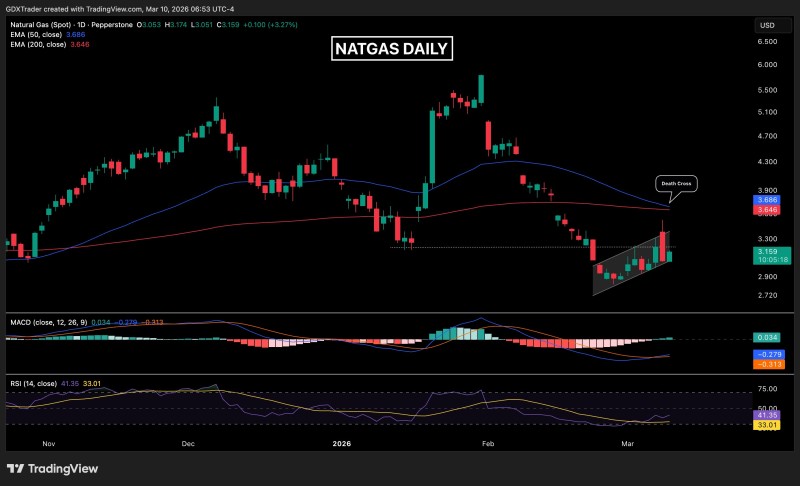
MACD Improves, but a Death Cross Threatens the Recovery
The MACD histogram is edging upward, signaling that short-term momentum may be stabilizing. That is encouraging. However, a potential death cross is forming as the shorter moving average approaches a bearish crossover with the longer one. This kind of setup has played out before, as seen when natural gas slid to $3.388 after a bearish kicker pattern, and analysts flagged the same pattern of price weakness below key averages.
Natural gas is also one of the most volatile commodity markets, with annualized volatility ranging between 50% and 120%, far above typical equity market levels. That means compression phases like the current one often precede sharp directional moves. The drop below $3 earlier this year showed just how fast the market can shift when structure breaks. For now, NATGAS needs a clear reclaim of the $3.64-$3.68 zone to change the picture.
 Usman Salis


