 Marina Lyubimova

⬤ Natural gas took a beating recently, dropping about 8% before finding itself at the $3 support level. What we're seeing here is a textbook bear flag pattern playing out in real time.
⬤ The chart shows NATGAS hovering around $3.03 after that sharp decline. Here's where things get interesting—if this level holds, we could see a bounce back up toward the $4 zone, which would mark a solid recovery from recent lows. That $4 level isn't just random; it's where buyers and sellers have historically battled it out, making it a critical area to watch.
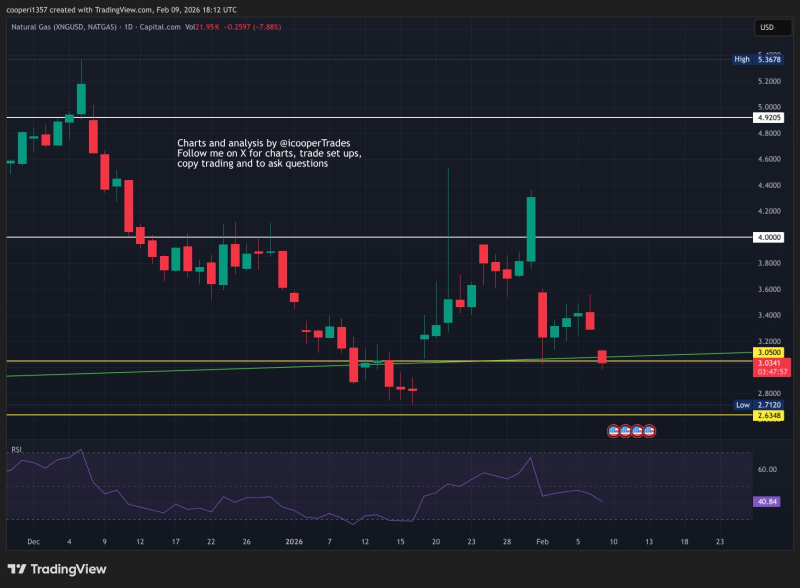
⬤ But here's the catch: the bounce we've seen so far hasn't been particularly convincing. If the $3 support crumbles, traders are eyeing the $2.63 level as the next major support zone where price might find stability. The analyst mentions this as their preferred entry point, though there's no guarantee we'll even get there.
⬤ What really matters now is how price behaves around these key levels. A decisive hold at $3 with some buying momentum could spark that move back toward $4. Break below $3, and we're likely heading down to test that $2.63 support. Either way, the next few sessions should give us a clearer picture of where natural gas is headed.
For more commodity market insights, check out Natural Gas Jumps 12% in Biggest Rally Since May, explore tradable commodities market analysis, and read about what makes commodities tradable in global energy markets.
 Marina Lyubimova


