 Usman Salis

⬤ Natural gas keeps sliding lower after recent technical warnings started flashing red. The bearish kicker candle that appeared earlier has triggered consistent downside momentum, and the latest session kicked off with a small gap down that delivered yet another bearish continuation candle. Right now, NATGAS is trading around 3.388 and heading straight toward an ascending support line that's been holding since late 2025.
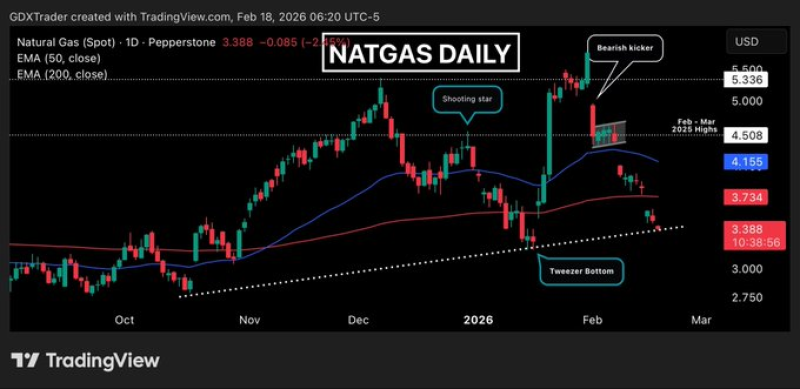
⬤ The chart tells a clear story - bulls tried pushing higher but got smacked down by a shooting star formation, and it's been downhill ever since. Price is sitting below the key moving averages, keeping the pressure on as it approaches what could be a make-or-break zone. We've seen this movie before when the market broke below $4 and started testing the $3 support zone.
⬤ Traders are glued to their screens watching for any signs that selling might be running out of steam near this support level. The same kind of price action showed up recently when natural gas tested $3 support after an 8% drop, and it's worth remembering that this market carries serious risk - something explained in detail in the analysis of why natural gas trading carries 50-120% volatility risk.
⬤ Everything now depends on how price behaves when it hits that ascending support. If buyers show up and stabilize things, we might see demand stepping in right at trend support. But if the selling continues without a pause, the bearish structure stays locked in place. This setup is a textbook example of how price action around technical levels decides which way natural gas swings next.
 Usman Salis


