 Saad Ullah

⬤ Gold's uptrend shows ongoing strength as the metal extends a parabolic rally into late February, carving out steep gains on the daily chart. The continued geopolitical uncertainty may underpin further upside, with price action remaining positive near $5,278.51. The graphic depicts a clear upward slope supported by dynamic moving averages beneath price, reinforcing the constructive trend.
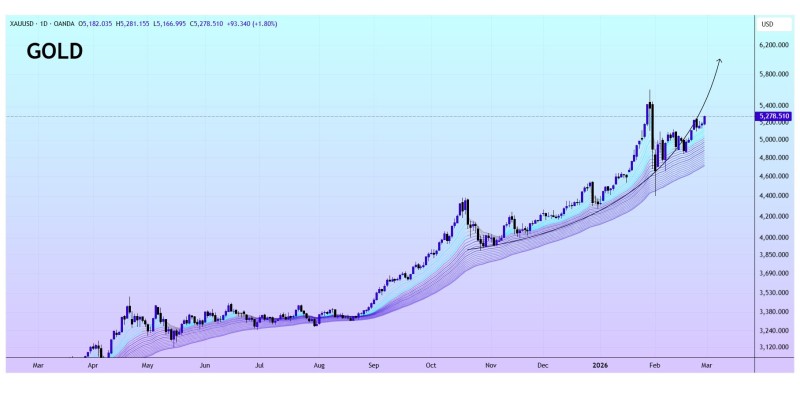
⬤ The chart reveals that Gold has risen sharply from lower levels earlier in 2025 and continued this trajectory through early 2026, with pullbacks absorbed well above underlying support bands. The parabolic shape of the rally is visible in the tightening of price swings and the steep ascent of the moving average ribbon. Technical commentary has noted that Gold remains technically bullish as long as key support levels hold, with resistance zones observed near prior ceilings like $5,130-$5,150.
⬤ Related technical articles underscore that Gold's momentum has been building for months, with price persistently respecting rising support and trending above key intermediate resistance levels. Recent analysis highlights that Gold has held constructive patterns while pressing near the upper boundaries of ascending formations. The combination of inflation expectations and safe-haven demand continues to fuel buying interest. Breaking above intermediate resistance has been associated with continued expansion of the prevailing uptrend structure.
⬤ The steepness of the current move and its resilience through minor pullbacks suggest that Gold's rally remains in progress, and the projected pathway points toward higher reference areas if momentum persists. While extremes can invite corrective phases, the prevailing structure signals that Gold may extend its gains beyond recent consolidation zones. Continued monitoring of price interaction with dynamic support will help clarify the next directional leg.
 Saad Ullah


