 Saad Ullah

⬤ Gold has carved out a textbook ascending triangle on the 4-hour chart, with price testing resistance near $5,100 to $5,120. The setup shows rising lows pushing against flat resistance - a clear sign buyers are building momentum above the moving average. Each dip since early February's correction has been met with fresh demand, creating a series of higher lows that trace out the pattern's rising support line and signal growing bullish pressure.
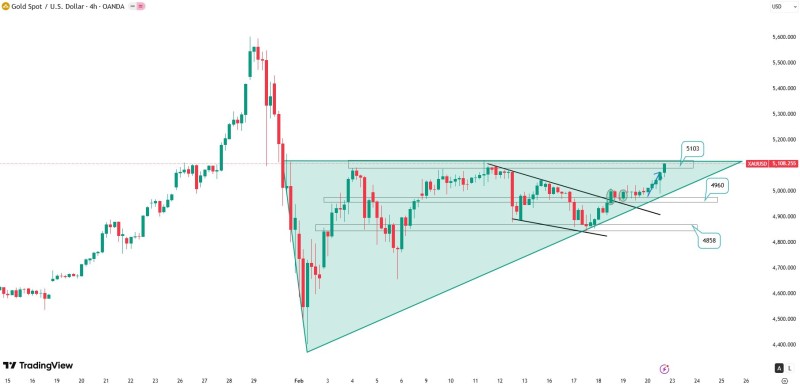
⬤ The triangle's upper boundary around $5,100 has been stubborn resistance, compressing price into tighter swings as support and resistance converge. Momentum looks cautiously bullish with price sitting above key moving averages, showing buyers remain engaged at these elevated levels. Key support sits near $4,960 and around $4,858, lining up with previous consolidation areas and the rising trendline that defines the pattern's lower boundary.
⬤ A clean break above $5,120 would confirm the bullish breakout, potentially opening the door to fresh highs beyond recent resistance. If that level holds and price gets rejected, expect more sideways action inside the pattern. Similar technical setups played out when Gold pushed past $4,260 inside an ascending triangle pattern earlier this year.
⬤ This setup matters because ascending triangles typically lead to sharp moves in the direction of the prevailing trend. A confirmed breakout above $5,120 would reinforce bullish sentiment and suggest XAUUSD has more room to run after recent consolidation. Previously, Gold's $4,570 support level determined the next major move during a similar technical inflection point. A rejection at resistance keeps traders watching support zones closely as central bank policy and macro headwinds continue to drive price action. With Gold nearing 5,043 resistance as the 14-week cycle high approaches, the next few trading sessions could be decisive for XAUUSD's near-term direction and whether bulls can finally break through this consolidation pattern.
 Saad Ullah


