 Eseandre Mordi

Gold (XAU) recent rally seems to be hitting pause as price action tightens on the hourly chart. After weeks of steady climbing, we're seeing a crucial inflection point where buyers and sellers are locked in a technical standoff. The setup hints that volatility could return soon, with the direction hinging on whether the market can hold its rising structure or finally break through overhead resistance.
Technical Picture: Caught Between Two Levels
According to trader Edmond Dantes, the current hourly chart shows gold squeezed between two critical zones—a rising trendline that's been supporting the uptrend and a horizontal resistance ceiling near $4,380 that's capping further gains.
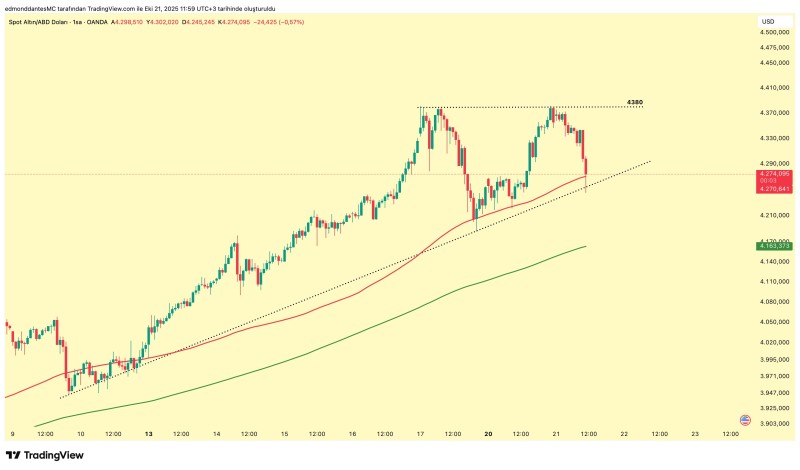
The chart shows how gold climbed from below $4,100 earlier this month before testing the $4,380 area twice, creating what looks like a potential double-top formation. Price has since pulled back to around $4,270, hovering just above the ascending trendline and red moving average that together form short-term support.
Key levels to watch:
- Bullish breakout: Sustained hourly closes above $4,380 would signal renewed upward momentum, potentially opening the door to $4,480–$4,500
- Bearish breakdown: A confirmed hourly close below $4,250 could trigger a corrective move toward $4,160–$4,180, where the 200-hour moving average sits
This compression pattern suggests momentum traders are sitting on the sidelines, waiting for confirmation before picking a side. When price does break out of this zone, it'll likely set the tone for the rest of the week.
Broader Market Context
Beyond the technicals, gold's hesitation reflects wider macroeconomic uncertainty. Investors are juggling stubborn inflation readings with slower rate-cut expectations from the Fed, while ongoing geopolitical tensions continue to underpin safe-haven demand.
If the upcoming U.S. inflation report comes in hotter than expected, rising yields could weigh on gold. On the flip side, a softer print might revive easing hopes and push gold through that $4,380 barrier.
 Eseandre Mordi


