Peter Smith

Gold opened this week under pressure, briefly dipping below a well-watched support level on the 1-hour chart before snapping back. The move looked alarming at first, but traders familiar with liquidity dynamics recognized it quickly: a sweep, not a breakdown. Price pushed under prior support, flushed out stop orders sitting below, then reversed. That kind of behavior resets positioning and can clear the way for a meaningful leg higher.
5,070-5,020 Demand Zone Holds the Key
The action zeroed in on a demand zone between 5,070 and 5,020. After the liquidity sweep, gold climbed back toward the 5,100 area, suggesting buyers were willing to defend that range.
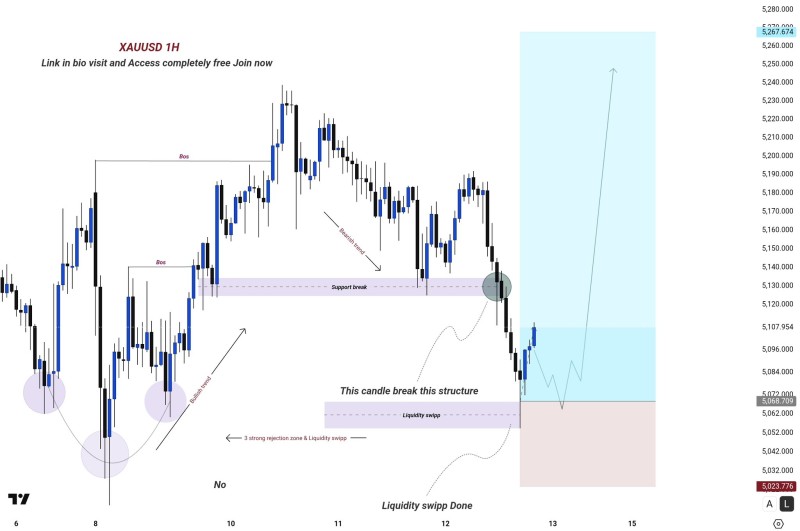
The pattern mirrors what played out in Gold Tests 5,180 Resistance as Hourly Recovery Rally Builds, where a short-term dip preceded a renewed push toward resistance. As long as price holds above the demand zone, the structure leans constructive.
Upside Targets: 5,180, 5,260, and Potentially 5,450
If gold manages to stay above the 5,070-5,020 support band, the technical map points to a sequence of upside targets. The first meaningful resistance sits near 5,180. A clean break there opens the door to 5,260, and if momentum accelerates, 5,450 comes into view. The idea is that the liquidity sweep completed the downside move, leaving room for expansion toward higher liquidity zones above. Gold Caught Between Trendline Support and $5,250 Resistance explored a similar setup, with gold coiling in a tightening range before a potential break.
The chart setup from Gold Price Analysis: $5,100 Ascending Triangle Signals Breakout reinforces the point: consolidation near key levels has repeatedly preceded directional moves in gold. The 5,070-5,020 zone now serves as the line in the sand. How price behaves around it over the coming sessions will likely set the tone for gold's next significant move.
 Peter Smith