 Alex Dudov

⬤ Gold is pushing higher after a sharp selloff, climbing toward the key 5,170-5,180 resistance zone on the hourly chart. Price is now recovering inside a small ascending channel that formed right after the drop. The 5,184 level is the main barrier to watch, where previous reaction highs and converging moving averages create a technically dense zone.
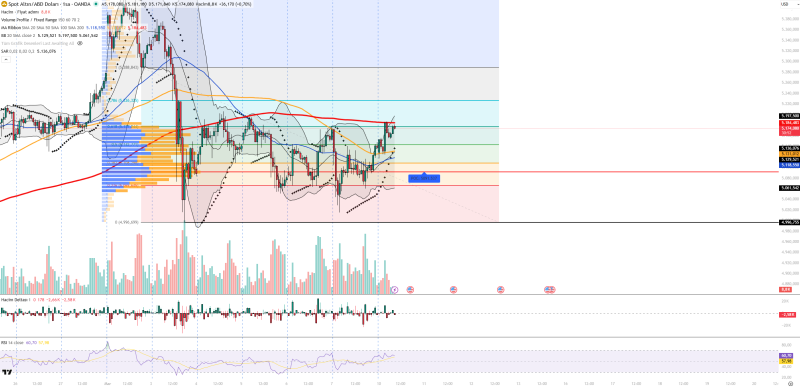
⬤ The structure around current price maps out clearly. Resistance sits at 5,174 and 5,184, with higher targets near 5,220 and 5,260. Below, support holds at 5,136 and 5,129, with deeper floors at 5,118 and 5,061. The Volume Profile Point of Control sits near 5,091, marking a zone of heavy historical participation. A similar post-correction setup played out in Gold Tests $4,900 Resistance After Rebound From $4,400 Low, where gold also struggled to clear resistance after a corrective bounce.
⬤ Momentum indicators back the short-term recovery. RSI is hovering near 60 - building strength without flashing overbought. Bollinger Bands show price pulling back toward the middle band, a sign of stabilization. Parabolic SAR dots have shifted below the candles, confirming the short-term bullish lean. Rising volume on recent candles adds weight to the move. This mirrors the pattern covered in XAU/USD Holds Near 4895 as Gold Consolidates Below 5100-5150 Resistance, where momentum shifts at resistance proved decisive.
⬤ Macro pressure remains a wildcard. Gold is still reacting to geopolitical headlines, oil price swings, and Fed rate expectations. Dollar strength continues to shape short-term sentiment. As analyzed in Gold Tests $5,043 Resistance With All-Time High Scenario in Focus, resistance clusters like the current 5,180 zone have historically acted as turning points - either launching the next leg up or sending price back for a retest of support.
 Alex Dudov


