 Marina Lyubimova

Gold is losing ground on the hourly chart, trading inside a short-term descending channel with sellers gradually tightening their grip. As the metal approaches the $5,145 support zone, traders are watching closely to see whether the level holds or gives way to deeper losses.
$5,145 Support Zone Holds the Key
Gold prices are facing short-term pressure as the metal trades below a descending trendline on the hourly chart. After rebounding from the $5,220 region, the price failed to hold upward momentum and drifted toward the $5,140-$5,150 support band.
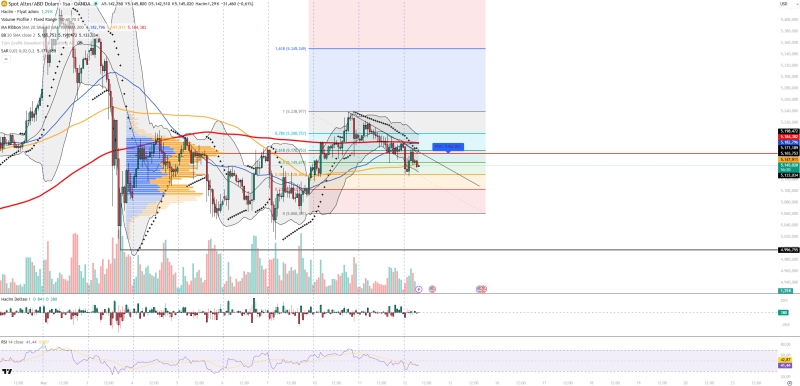
The structure reflects a corrective move inside a descending channel, leaving gold vulnerable to further downside if key levels crack. A liquidity cluster near $5,166 - aligned with the volume profile point of control - represents a firm resistance area. Deeper support sits at $5,133, $5,118, and $5,060 if the current floor breaks.
RSI at 41 and Parabolic SAR Signal Bearish Bias
Momentum indicators back the bearish picture. The RSI sits near 41, reflecting selling pressure without yet being oversold. Bollinger Bands show price approaching the lower band, a sign that short-term downside may continue. Parabolic SAR dots remain positioned above the candles, reinforcing the negative bias. Medium volume during the decline combined with a slight uptick in volume delta suggests sellers have been quietly building control over recent sessions.
Broader macro conditions add complexity. Gold Must Hold $5,004 Next Week to Keep Bullish Momentum - rising oil prices are feeding inflation expectations, which supports the dollar and adds weight to gold. Geopolitical tensions, however, keep safe-haven demand alive beneath the surface.
The technical setup echoes themes covered in Gold Price Analysis: Critical $4,280 Support Level in Focus, where analysts stressed how key support zones shape the next major directional move. A similar dynamic played out in Gold Price Analysis: $5,100 Ascending Triangle Signals Breakout, where a structural breakdown triggered accelerated selling. With gold now testing the lower boundary of its short-term range, the reaction around $5,145 may define whether the market stabilizes or extends its correction.
 Marina Lyubimova


