 Artem Voloskovets

⬤Brent crude has rallied strongly this year, climbing more than two-thirds since January. Despite the scale of the move, long-term inflation-adjusted charts tell a more measured story. Real price data adjusted using core U.S. CPI shows the benchmark trading only slightly above its average since the start of the century.
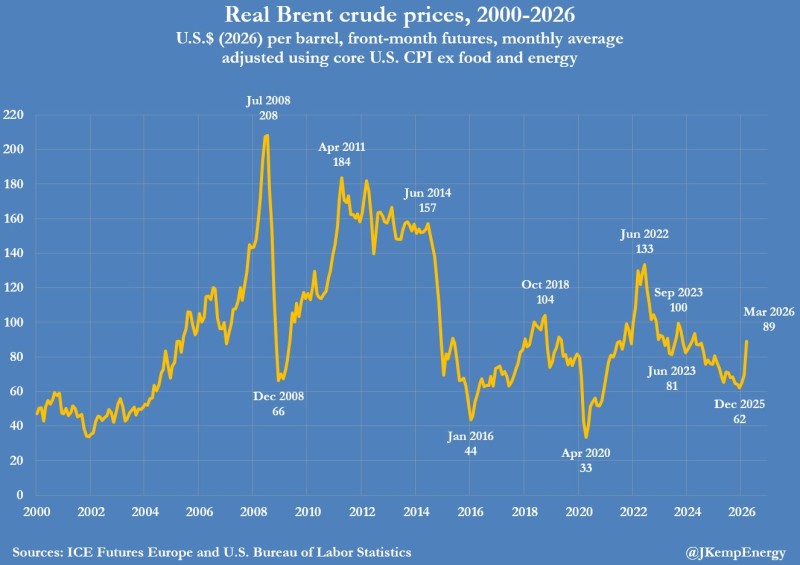
⬤Real Brent prices remain well below several major peaks of the past two decades. The chart highlights extremes like July 2008, when real prices hit roughly $208 per barrel, and April 2011, when they neared $184. Other elevated points include June 2014 near $157 and June 2022 around $133. March 2026 readings near $89 place current levels far from historically extreme territory. This context was also explored in Brent Crude Holds Near $72 as Oil Benchmarks Approach Multi-Month Highs.
⬤The longer historical series shows just how volatile oil markets have been across cycles. Prices collapsed in late 2008 during the financial crisis, dropped to around $44 in January 2016 after the 2014-2016 downturn, and hit a low near $33 in April 2020 during the pandemic demand shock. Against that backdrop, the recent climb looks far closer to a reversion to the mean, a pattern covered in Oil Prices Jump 4.6% in January 2026 After Five-Month Slide.
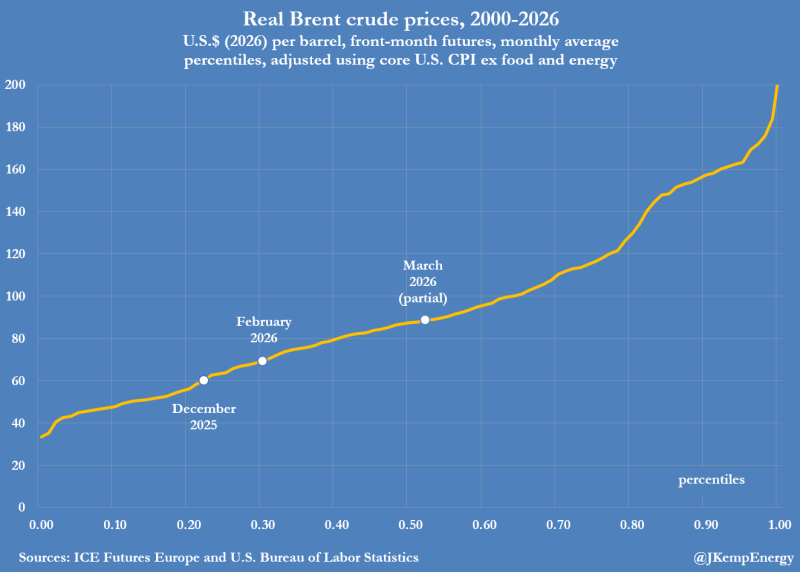
⬤Percentile analysis of real oil prices reinforces the moderate picture. The distribution places current levels near the middle of the long-term range, not near the upper tail. Nominal gains this year have been meaningful, but the inflation-adjusted view keeps things in perspective. Broader forecasts on where prices could head next are covered in Oil Price Forecast: Goldman Sachs Warns Brent Could Hit $100 in 5 Weeks.
 Artem Voloskovets


