Eseandre Mordi

ZETA Global Holdings is stabilizing at a critical technical level, where holding support could determine whether the stock transitions out of its broader consolidation. Technical analyst Fibby. notes that the weekly chart shows price respecting a clearly defined demand zone, while repeated failures at overhead resistance keep the structure unresolved - for now.
The chart shows a strong prior uptrend into late 2024, followed by a clear loss of momentum and a transition into sideways price action. Since then, ZETA has been trading within a defined structure, with support forming in the mid-$14-$16 area and resistance near $20.
A range that refuses to break
What stands out on the weekly timeframe is the consistency of reactions at the demand zone. Multiple pullbacks into this area have held, preventing further downside and reinforcing it as a key level that bulls must defend. The green zone has acted as a floor that the market keeps coming back to - and keeps bouncing from.
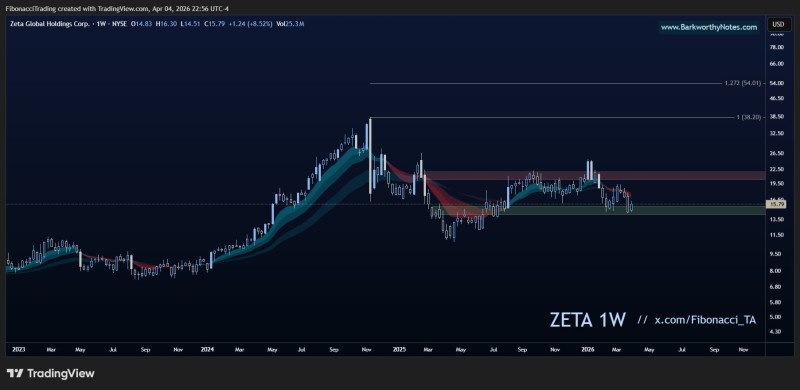
This is not a weak or coincidental support level. The repeated tests without a breakdown speak to genuine buying interest at these prices, even as the broader trend remains unclear.
Pressure builds beneath $20 ZETA resistance
While support has held, the structure is not yet bullish. Price continues to trade below the $20 resistance zone, which has repeatedly capped upside attempts. This level acts as a ceiling within the range and marks the point where prior rallies have failed to continue.
The current structure reflects compression between support and resistance - often a precursor to expansion. That kind of coiling tends to resolve in one direction with force, and a ZETA price break above $22 could trigger a $33 move based on prior technical projections.
The setup ZETA traders are watching
The direction of the next expansion will define the next phase for ZETA stock. Three scenarios are currently in play:
- Holding above the demand zone keeps the bullish scenario intact
- A breakout and hold above $20 would signal a shift in trend
- Upside targets extend toward $38 and $54 if momentum confirms
These higher targets align with prior major levels on the chart, representing areas where price previously reacted. At the same time, the downside remains clearly defined. A loss of the demand zone would invalidate the setup and confirm that the range is breaking lower instead of higher.
Traders tracking ZETA stock after its drop to $19.52 following a faded rally are watching exactly this inflection point - whether the demand zone can absorb selling pressure one more time, or finally give way.
ZETA stock is not trending - it is coiling. And in markets, that kind of structure rarely stays unresolved for long
 Eseandre Mordi