 Usman Salis

Zeta Global is sitting at a technical inflection point. The stock has been grinding below key resistance levels after a prolonged decline, and traders are watching two price zones closely: $19.54 and $22.19. Which way ZETA breaks from here could define the next major leg.
Resistance at $22.19 and Downside Risk Near $13.77
The current chart structure tells a cautious story. ZETA is trading below both $19.54 and $22.19 resistance zones, meaning bullish momentum has not been confirmed. More notably, the stock has yet to test its 200-week moving average near $13.77, which leaves the door open for further downside. Support levels at $16.17 and $14.53 are the lines in the sand on the way down. The ZETA Stock Falls 8% Toward Lower Trendline as SaaS Weakness Persists episode, where shares dropped toward the mid-$14s on sector-wide pressure, shows this kind of move is well within range.
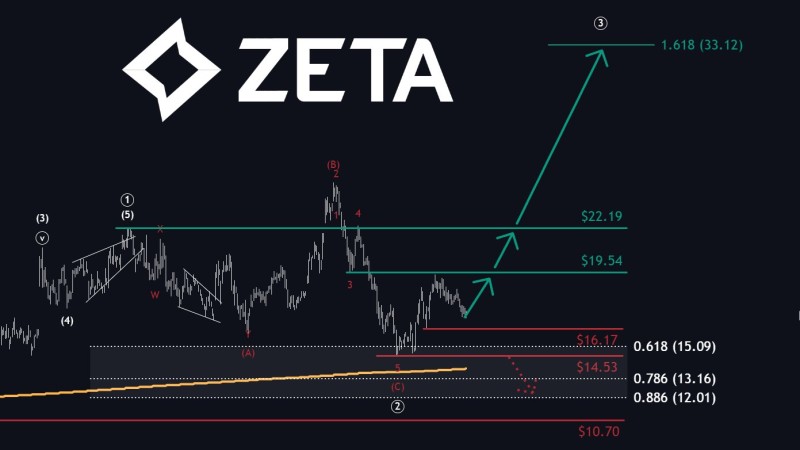
$22.19 Breakout Remains the Key Trigger for a Move to $33+
The bearish case does not erase the bull setup. A pattern like the one seen in ZETA Global Tests 1.618 Support After 30% Drop can serve as a base for recovery, and that appears to be what the chart is building toward. A confirmed close above $19.54, followed by a reclaim of $22.19, would shift momentum and open the path toward the $33 region. That setup was outlined in ZETA Stock Setup: $22.19 Pivot in Focus Ahead of Earnings Volatility, where the $22.19 level was flagged as a potential trigger for a move into the $33-$44 range. Until that breakout happens, sellers remain in control and the 200-week moving average near $13.77 stays on the radar as the ultimate downside target.
 Usman Salis


