 Saad Ullah

⬤ Zeta Global Holdings Corp. stock tumbled lower and is now sitting at a critical technical level. ZETA has dropped roughly 30% from earlier highs and is currently testing support near the 1.618 Fibonacci extension zone.
⬤ The chart reveals a five-wave decline, with price sliding toward the $14.70 area after previously trading between $23 and $25. This zone marks a historically important retracement region where reactions often decide whether selling eases or intensifies. Similar support behavior appeared when ZETA stock drops to $17.7 support triggered earlier this year.
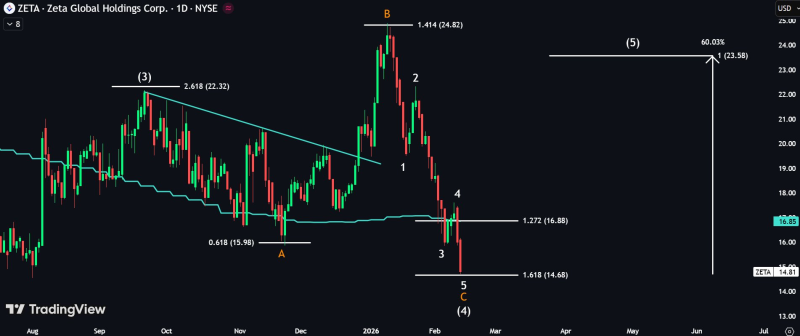
⬤ Technical projections suggest that if support holds and consolidation takes shape, a short-term wave five recovery could unfold. Comparable corrective setups surfaced when ZETA stock rejected at $20 monthly support band and in broader retracement patterns discussed when HIMS rebounds from Fibonacci level.
⬤ The setup places ZETA at a technical fork in the road. Holding a deep extension level could stabilize price structure, while failing to hold may extend the correction as traders adjust positioning around momentum and support reactions.
 Saad Ullah


