 Saad Ullah

⬤ ZETA is back on watchlists ahead of next week's earnings, with the technical picture sitting at a potential inflection point. The bias remains bullish with a mid-term target between $33 and $44, while acknowledging that the bottom may already be in. At the same time, the post flags the 200-week moving average area near $13.60 as a possible "one more leg down" support zone if the stock fails to hold current structure.
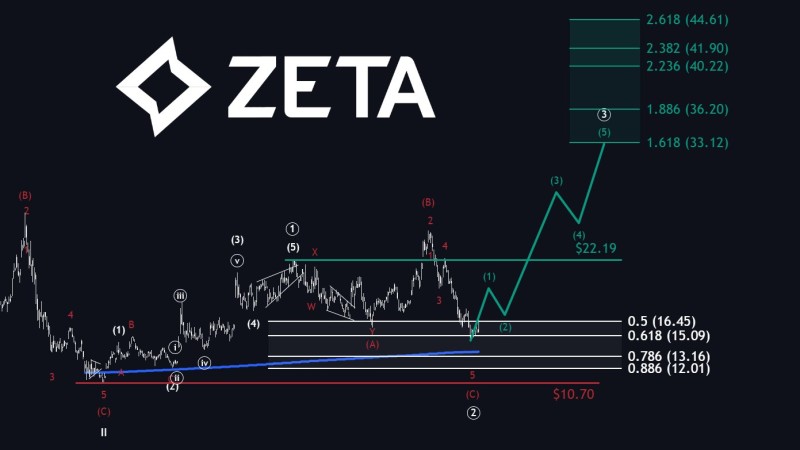
⬤ The chart highlights a clear decision level at $22.19, marked as a key horizontal pivot. Above that area, the roadmap points to Fibonacci extension targets at $33.12 (1.618) and up through $44.61 (2.618), matching the $33-$44 target band. The setup also sketches intermediate extension levels around $36.20, $40.22, and $41.90, suggesting any sustained breakout could unfold in stages rather than one straight shot higher.
⬤ On the downside, layered support zones sit at $16.45 (0.5) and $15.09 (0.618), followed by deeper levels at $13.16 (0.786) and $12.01 (0.886), with $10.70 marking extreme downside. With earnings approaching, price can swing sharply. Recent weakness saw ZETA stock drop 6% after rejection at key support, showing how quickly sentiment shifts around technical levels.
⬤ Earnings week often confirms whether a technical roadmap is actionable or premature. Earlier this year, Zeta Global tested 1.618 support after a 30% drop, showing how sharp corrections reset structure. If price reclaims $22.19, the $33-$44 ladder stays intact. If not, mid-teens support and the 200-week MA become critical. Currently, Zeta Global shares trade at $21.75 in rising trend, just below the pivot determining the next major move.
 Saad Ullah


