Saad Ullah
⬤Zeta Global Holdings is drawing attention from traders as the stock moves toward a significant support area on the longer-term chart. Currently trading around $17-$18, ZETA is approaching the intersection of two major trendlines projected near $14.50. The analyst who previously swing traded ZETA successfully noted that if price hovers near that level around July, it could become a compelling area to reload a position.
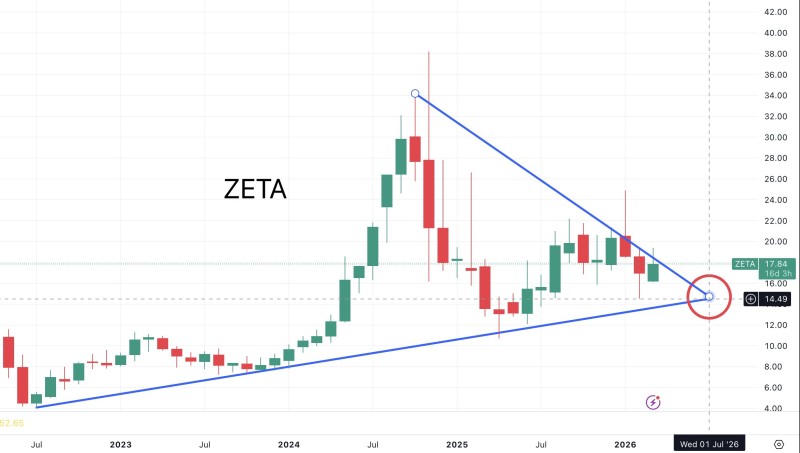
⬤The chart structure features a rising support trendline extending from 2022 and a descending resistance line drawn from the stock's peak above $30. Together they form a tightening wedge that compresses price toward a convergence point near $14.49 - a level highlighted as ZETA slides 8% toward its lower trendline amid SaaS sector weakness. Wedge formations like this typically signal a decision phase as buying and selling pressure narrow toward a single zone.
⬤ZETA's recent price history tells a clear story. A strong 2024 rally pushed the stock from below $10 to above $30, followed by a corrective phase that dragged it back into the mid-teens. During this consolidation, ZETA has been trading between roughly $15 and $22 on the monthly chart, forming a well-defined range. The current drift toward the lower boundary reflects the broader pressure weighing on SaaS names.
⬤The convergence of long-term support near $14.50 represents a technically important inflection point. How ZETA reacts to this zone could determine whether the consolidation phase continues or gives way to a new directional move. Zeta Global is already testing the $15-$16 support band as the broader tech slide persists, making the $14.50 level one to watch closely in the weeks ahead.
 Saad Ullah