 Saad Ullah

⬤ Tesla (TSLA) is sliding into a technical zone that traders are keeping a close eye on. The stock just reached the lower edge of a target region, and there's a chance we'll see a pullback from here. Analysts have marked $419.23 as the preferred target for TSLA, sitting inside a wider Fibonacci-based zone that could dictate the next move.
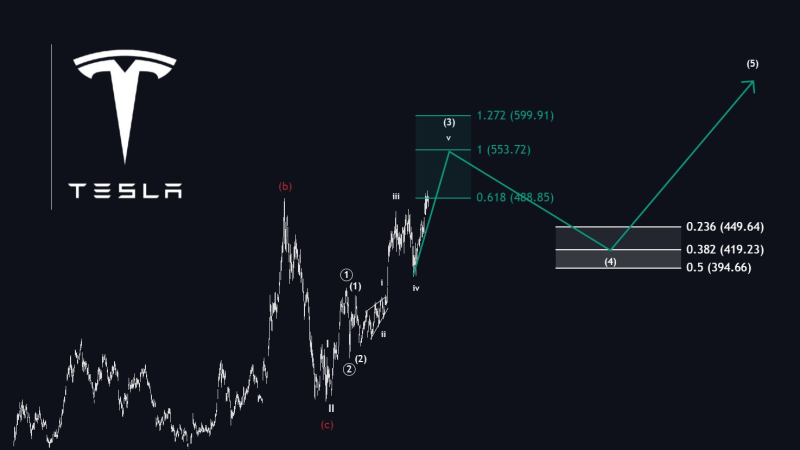
⬤ The chart maps out a price box between roughly $394.66 and $449.64, with that $419.23 level right in the middle. If TSLA hangs around inside this band or bounces back into it, that could signal a potential entry point. The analyst also mentioned that if Tesla keeps moving, the target zone might shift a bit as the price action develops.
⬤ The Elliott Wave setup on the chart suggests the market might be working through a pullback phase labeled as wave (4), with the retracement likely playing out inside the highlighted zone. Above that area, there's a roadmap pointing toward higher levels, though the main focus right now is on near-term movement into the target band rather than any long-range forecast for TSLA.
⬤ This technical picture matters because Tesla is one of the most-watched names in tech and EVs. When TSLA moves into well-defined zones like this, it can shift sentiment and momentum across growth stocks. Traders will be watching how price behaves inside this target region and whether the technical framework needs any tweaks.
 Saad Ullah


