 Marina Lyubimova

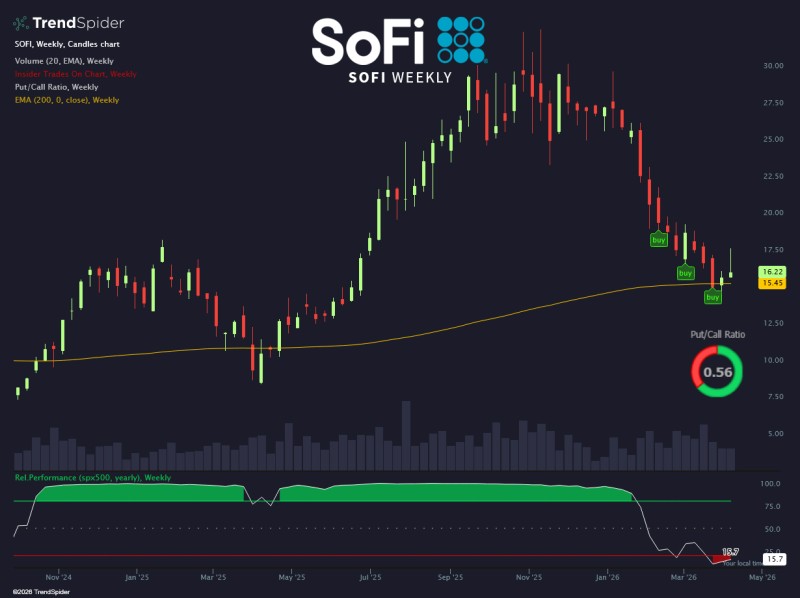
After months of steady selling pressure, SOFI stock is starting to show something it has not shown in a while - a pause. TrendSpider flagged the shift, pointing out that neither insiders nor options traders appear to be positioning for further underperformance. It is a subtle but meaningful change in tone for a stock that spent most of the recent period making lower highs and lower lows.
Insiders and options traders do not appear to expect continued underperformance - a potential shift in sentiment is forming beneath the surface.
SOFI Stock Downtrend Is No Longer Accelerating
The chart tells a clear story. From highs near $30, SOFI sold off into the mid-teens through a sustained sequence of lower highs and lower lows - a textbook bearish structure. But the character of that move has changed. Price is no longer pushing aggressively lower. Instead, it has shifted into a sideways grind, which in itself is a form of progress when the prior trajectory was straight down.
Consolidation after a prolonged decline is not a bullish signal on its own, but it does suggest that active selling pressure is easing. The market is pausing to reassess rather than continuing to unload.
Price is moving sideways near the current range, suggesting a transition from a directional move into consolidation rather than continued selling pressure.
SOFI Price Holds Near Key Long-Term Support at $15 - $16
The most structurally significant element on the chart is where price has chosen to stabilize. The 200-week moving average sits roughly in the $15 to $16 zone - and that is precisely where SOFI has been holding. This is not a coincidence. Long-term moving averages at this scale carry real weight, especially for stocks in recovery mode.
This same area has been consistently flagged as a critical zone of activity. As covered previously, SOFI stock anchored at $16 as institutional battle intensifies, with over 116 million shares involved in dark pool positioning around this level. The fact that price has not broken meaningfully below this zone - despite weeks of opportunity - is itself informative.
Positioning Data Behind the SOFI Stabilization Signal
Beyond the price chart, several secondary indicators are reinforcing the stabilization thesis:
- Put/Call ratio near 0.56 - no extreme bearish positioning present
- Insider activity markers appearing near current price levels
- Relative performance versus the S&P 500 flattening after a sustained decline
Taken together, these data points match the core observation: the market is not actively betting on further downside from here. That does not mean a rally is imminent, but it does indicate that the risk profile around the current base is shifting. In an earlier setup covered here, SOFI support hold at $16 - $19 was seen as a potential trigger for a move toward $28 - a scenario that becomes more relevant the longer price holds this zone.
Market participants are not positioning for continued underperformance at this stage - the data points toward a base forming rather than a breakdown accelerating.
SOFI Stock Structure Still Neutral - Waiting for Confirmation
It is worth being honest about what stabilization means and what it does not. SOFI is still trading below the resistance levels carved out during the downtrend. No breakout has occurred. The structure is neutral, not bullish. A consolidation can resolve in either direction, and until price clears those overhead levels, the bias cannot be called a recovery.
For context on where a genuine recovery might target, SOFI targets $61 as a pullback tests a key Fibonacci zone - outlining the longer-term technical levels that would come into play in a full trend reversal. Whether that scenario gets traction will depend entirely on how price behaves around the current $15 - $16 base in the weeks ahead.
 Marina Lyubimova


