 Usman Salis

SoFi Technologies is now trading within a critical retracement zone after a sharp decline from recent highs, placing the stock at a technical inflection point. According to StockChaser, the broader setup still points toward a potential $61 target, but current price action shows the market testing whether the pullback can stabilize.
SOFI Pullback Enters the 0.5-0.618 Fibonacci Zone
The chart shows SOFI rallying into the low-$30s before reversing sharply, forming a clear downward leg. Price is now sitting within the 0.5 to 0.618 Fibonacci retracement zone, roughly between $18 and $15.
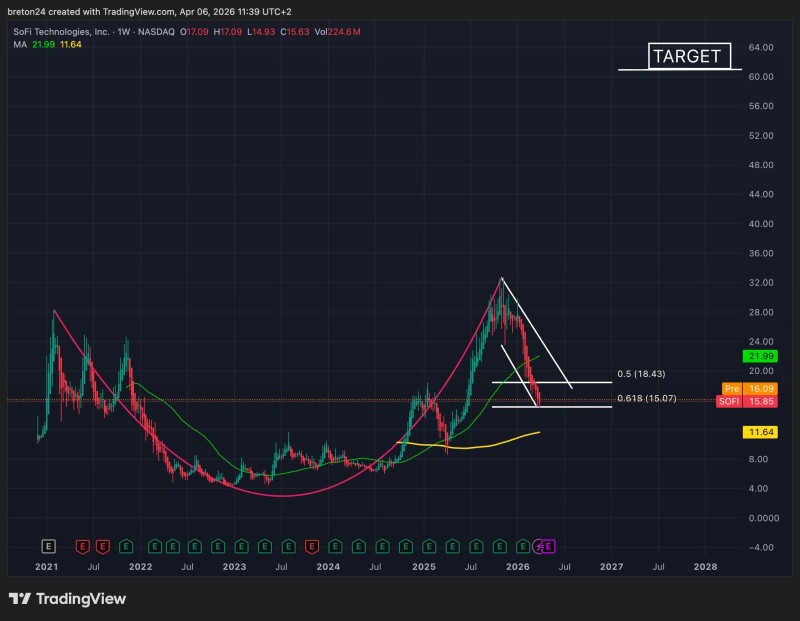
This area is explicitly marked on the chart and represents the current trading region. The move into this zone reflects a continuation of the pullback rather than a confirmed reversal.
Price is testing a critical retracement zone between $18 and $15, where the next directional move will be decided.
Similar retracement behavior has been observed in SOFI Stock Analysis: Support Hold at $16-$19 Could Trigger Move to $28, where price action centered around the same range defined near key Fibonacci levels.
SOFI Stock Structure Remains in a Corrective Phase
The chart outlines a projected path that suggests further downside movement before any potential recovery. A descending trajectory is drawn from the peak, indicating that the corrective phase may not yet be complete.
Price has not reclaimed higher levels, and the structure remains within a downward move following the peak. The current position near the 0.618 level reflects interaction with support, but not confirmation of a base.
The corrective phase may not yet be complete - the structure is still working its way through a defined downward trajectory from the peak.
This aligns with setups like SOFI Stock Stalls in No Man's Land - $12.75 Target Emerges, where the chart remained in a corrective phase without a confirmed reversal pattern.
SOFI $61 Target Depends on Broader Multi-Phase Structure
The $61 target sits far above current price levels and is a long-term projection. The chart labels it separately, making clear that it depends on a broader structural development rather than the current move alone.
The $61 level is a structural target tied to a larger multi-phase pattern - it doesn't come from what the market is doing right now.
This type of projection is consistent with longer-term pattern frameworks, such as SOFI Stock Analysis: Cup & Handle Pattern Signals $61 Target Potential, where the same target level is tied to a larger multi-phase structure rather than immediate price action.
At present, the chart reflects a market still within its corrective leg, trading inside a defined retracement zone while a much larger upside target remains conditional on future structure.
 Usman Salis


