 Marina Lyubimova
SoFi Technologies (SOFI) is sitting nearly 50% below its previous highs, with the stock closing at $17.37 on March 17, 2026, and a slight post-market uptick doing little to change the broader picture. The earlier rally pushed SOFI into elevated valuation territory, and the market has been unwinding that premium ever since. Price action over recent months reflects that correction in full force.
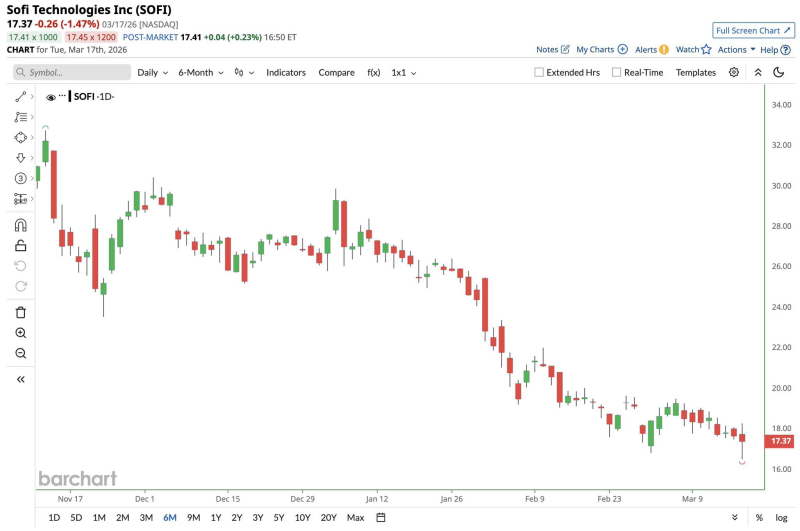
The six-month daily chart tells a straightforward story: SOFI has trended from above $30 down toward the $17 range, with a consistent pattern of lower highs and lower lows. There have been brief patches of stabilization, but nothing that points to a confirmed reversal. As covered in recent market analysis, the stock is currently testing a $19 to $13 reversal zone that traders are watching as a critical decision area.
On the valuation side, the picture has shifted considerably. With SOFI trading near $17 to $18, the stock is now priced at roughly 20 times projected 2027 earnings, a meaningful compression from where it stood at the highs. Management is guiding for annual earnings growth of 38% to 43% through 2028, and some analysts still see meaningful upside. A recent SOFI price forecast put potential analyst targets as high as $38, contingent on execution and market conditions holding up.
What SOFI is going through is not unusual for high-growth fintech names. Sharp rallies attract premium valuations, and when momentum fades, the correction tends to be equally sharp. From a longer-term technical standpoint, some setups remain constructive: a cup and handle pattern analysis has previously flagged a potential $61 target. Whether that scenario plays out depends almost entirely on whether the earnings growth story holds through 2027 and 2028.
 Marina Lyubimova


