 Artem Voloskovets

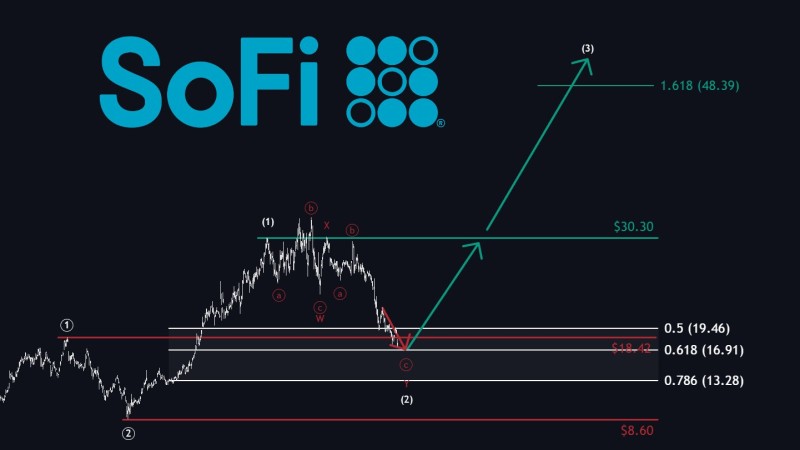
⬤ SoFi's weekly chart shows the stock approaching a crucial reversal zone between $19.46 (0.5 Fib) and $13.28 (0.786 Fib) after pulling back from highs above $30. This range could mark where buyers step back in. Right now, SOFI is testing the lower end with $16.91-$19.46 acting as the immediate battleground. The setup includes an invalidation level at $8.60 - drop below that and the bullish case falls apart.
⬤ The weekly pattern reveals a classic corrective wave sitting just above important historical support. Past coverage noted how SOFI's breakdown from $24-$25 signaled technical weakness and the need for this exact support test. Now traders are watching to see if current levels can hold.
⬤ If this reversal zone proves solid, technical models project the next major target near $30.30, with the 1.618 Fibonacci extension pointing toward $48.39 down the road. Earlier analysis identified a Cup & Handle pattern targeting $61, showing multiple technical scenarios support upside potential.
⬤ What matters most is how SOFI behaves around this range. Holding above keeps the bullish outlook alive and could mark the shift from correction back to expansion. But a close below $8.60 flips the script entirely. The next few weekly closes around these key Fibonacci retracements will determine whether this becomes the launchpad for the next rally or just another consolidation chapter.
 Artem Voloskovets


