 Usman Salis
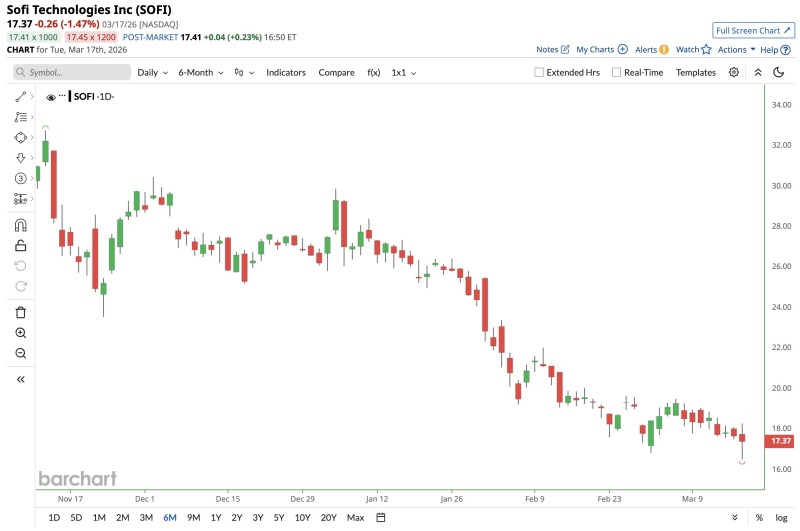
SoFi Technologies has shed nearly half its value since hitting highs above $34 in late 2025. The stock is now trading close to the $17 mark, and the chart structure offers little comfort for bulls - a textbook series of lower highs and lower lows still firmly in control heading into early 2026.
SOFI Loses 50% From Peak: $17 Zone Now the Last Meaningful Floor
The decline from the November peak was gradual at first, then accelerated sharply as SOFI broke through multiple support levels without meaningful resistance. Shares briefly stabilized in the $20-$22 range, but buyers were unable to hold that zone - and the stock rolled over again. As SOFI Holds Critical $17 Support After Pullback From $28 Highs outlined, the $17-$19 area has since emerged as the key region where any real demand needs to show up.
$16.95 Fibonacci Level and the $38 Recovery Case
The current price action is showing early signs of stabilization - candles are getting shorter, volatility is compressing. But that alone does not flip the broader structure. Former support zones now act as overhead resistance, capping recovery attempts before they gain traction. The specific level to watch is discussed in SOFI Stock Eyes Rebound After Testing $16.95 Fibonacci Support Zone, where $16.95 is identified as a key technical floor derived from Fibonacci retracement levels.
Longer-term scenarios look more constructive only if SOFI can reclaim significantly higher levels. Analysis in SOFI Price Forecast: Analysts See Potential Upside to $38 maps out a recovery path, but it hinges on breaking through resistance zones that the stock has repeatedly failed to clear during recent bounces.
For now, the $17 area is the line in the sand. A hold here with follow-through buying could set up a base. A break below puts the broader downtrend firmly back in the driver's seat, with limited obvious support below current levels.
 Usman Salis


