 Usman Salis
⬤SoFi Technologies is drawing attention on the weekly chart as the stock tests a key technical level near $17. Holding above this level suggests the market may be flipping a former resistance zone into support. SOFI is currently trading in the $18-$19 range following a pullback from recent highs, placing it right at a critical technical threshold.
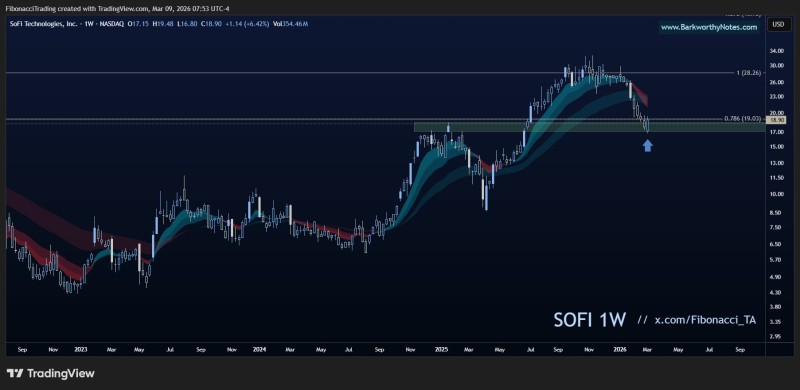
⬤The broader price structure shows SOFI staged a strong rally through 2024 and into early 2025 before entering a corrective phase. After reaching highs near $28, the stock retraced toward the $17-$19 area, which aligns with a Fibonacci retracement confluence around $19.03. As covered in SOFI Stock Eyes Rebound After Testing $16.95 Fibonacci Support Zone, this $17 zone has emerged as a key base for potential stabilization.
⬤The weekly chart shows SOFI interacting with an EMA ribbon that supported the trend during its earlier rally phase. After the pullback, price has returned into this technical cluster where traders watch for signs of stabilization. Notably, SOFI Stock Shows Bullish Divergence Near Key $18.83 Fibonacci Level highlighted that a bullish RSI divergence appeared while the stock attempted to reclaim the $18.83 Fibonacci level.
⬤Despite the correction, the trend structure for SoFi Technologies remains constructive as long as the $17 floor holds. Maintaining this level could reinforce the resistance-to-support narrative. Broader outlook discussions, including SOFI Price Forecast: Analysts See Potential Upside to $38, indicate the stock continues attracting attention as it consolidates after its earlier rally.
⬤The reaction around the $17 level will likely shape SOFI's next directional move. A sustained hold could confirm the prior resistance has converted into durable support. A breakdown below the zone, however, would extend the current consolidation and force the market to reassess the strength of the previous uptrend.
 Usman Salis


