 Usman Salis

⬤ SoFi Technologies (SOFI) came under sharp pressure after Muddy Waters disclosed a short position and raised concerns about balance sheet transparency. The stock dropped around 6% intraday, with shares sliding to $17.09 before partially recovering. Negative sentiment spread quickly as the report circulated, amplifying an already fragile technical backdrop following a prolonged decline from highs above $30.
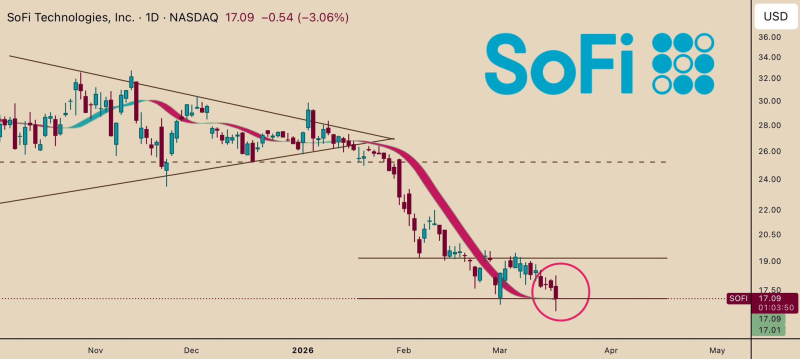
⬤ The selloff briefly pushed SOFI below its 1-day Hull Moving Average ribbon before the stock reclaimed that level. While the recovery suggests some resilience, the broader chart structure remains weak. Sustained selling through February and March has left price consolidating near multi-month lows, with the HMA now serving as a short-term benchmark for any stabilization attempt. Per SOFI technical reversal range analysis, this zone has repeatedly acted as a major decision point for price action.
The reaction to the short seller report demonstrates how quickly sentiment can shift, with technical levels now playing a central role in determining near-term direction. The Tradable
⬤ The $17 zone is now acting as a critical floor. The SOFI stock rebound analysis previously flagged the $16.95-$17 area as a key Fibonacci support level, and more recent coverage in SOFI $17 support zone breakdown confirmed this range as a high-stakes decision point following the pullback from $28 highs.
⬤ For SOFI, holding above the 1-day HMA and defending the $17 level could stabilize near-term price action despite the negative headlines. Failure to maintain this floor would likely open room for further downside, making the current range one of the most technically significant moments in SOFI's recent trading history.
 Usman Salis


