 Alex Dudov
⬤ SoFi Technologies stock is showing clear signs of technical weakness on the daily chart, trading around $24.36 after failing to hold recent highs. Price is moving lower within a tightening pattern, marked by a descending trendline following what was a powerful advance. The breakdown is becoming more evident as momentum indicators stay quiet.
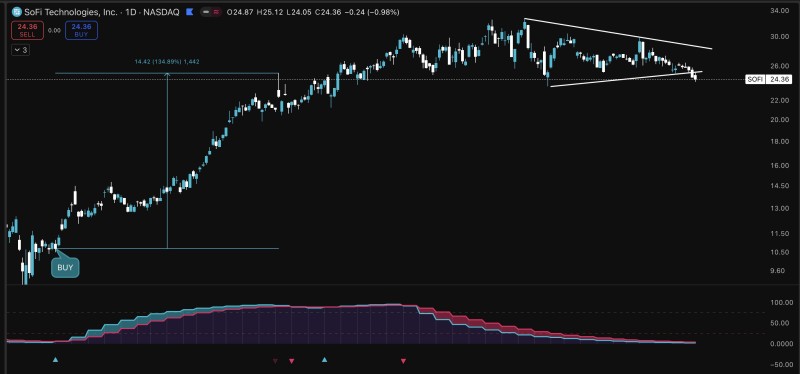
⬤ The earlier rally was impressive—SOFI climbed from near $10 all the way to roughly $25 before running out of steam. That move happened when momentum turned positive and stayed that way, driving strong upside action. But since hitting those highs, the stock has shifted into consolidation mode, forming lower highs and drifting toward the bottom of its recent range.
⬤ Momentum indicators shown at the bottom of the chart remain muted, signaling weaker buying pressure compared to the uptrend phase. While there hasn't been a full reversal yet, the chart suggests momentum may be nearing a potential turning point, which traders are watching closely.
⬤ This matters for the broader market because SoFi has been a high-profile momentum play in the fintech space. When stocks like this cool off after big runs, it can shift sentiment across similar growth names. How SOFI behaves around current levels—and whether momentum stabilizes or keeps fading—could set the tone for volatility and direction across the sector in the near term.
 Alex Dudov


