 Usman Salis

⬤ SoFi Technologies dropped after losing its tightening wedge pattern on the weekly chart. The breakdown triggered technical selling that pushed shares lower, but the decline slowed when price hit a major demand zone where buyers stepped in to absorb the pressure.
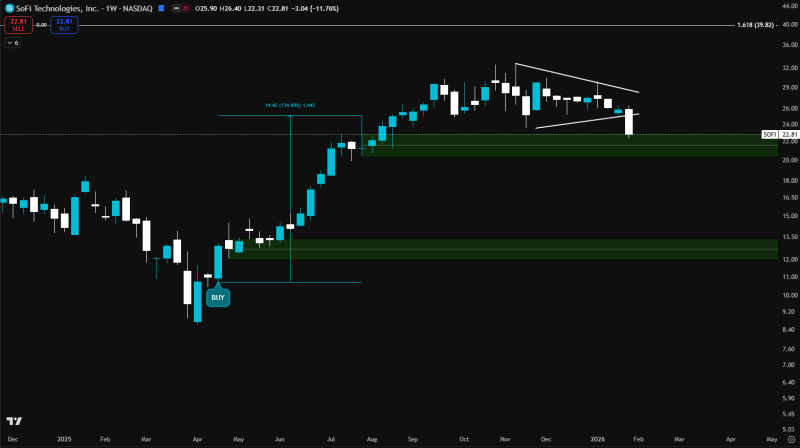
⬤ The pullback came after a strong rally earlier this year that took SOFI from the low teens up into the upper $20s. That climb created several support zones, and the nearest one—sitting in the low-$20 range—is now doing the heavy lifting. Despite a sharp weekly drop, the stock has managed to stay inside this zone, which means sellers haven't fully taken over yet.
⬤ From a technical standpoint, this support area could be the turning point. If it holds, SOFI might stabilize and work its way back toward the $30 level, which lines up with previous highs and typical recovery targets after corrections like this. But if support fails, the stock could slide toward deeper levels established earlier in the trend.
⬤ The setup matters beyond just SoFi—it shows how growth stocks react after big rallies and technical breakdowns. If SOFI can defend this zone, it might lift sentiment across the fintech sector. The next few weekly closes will make it clear whether this becomes a rebound story or turns into a longer consolidation phase.
 Usman Salis


