Peter Smith
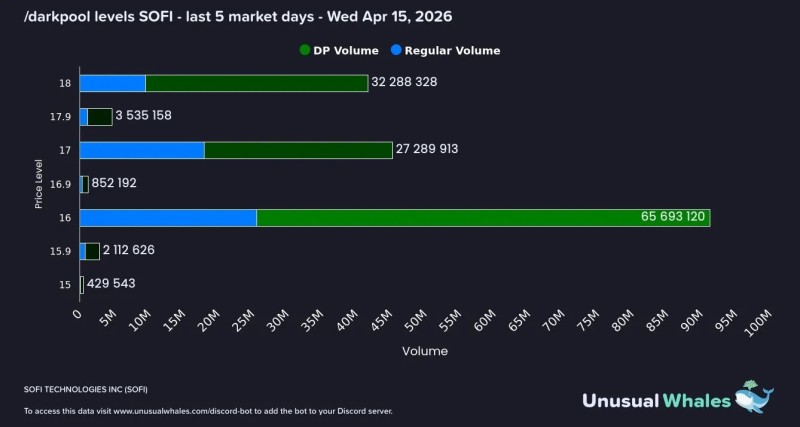
SOFI is showing one of its clearest institutional setups in recent sessions. Dark pool data points to a higher and broader accumulation zone beneath price, with the center of gravity moving away from $15 and into a stacked band covering $16, $17, and $18. According to Fibby, large buyers appear to be repositioning at higher levels - a shift that changes the structural read on the stock considerably.
$16 remains the primary anchor at 65.7 million shares, while $17 and $18 have joined with 27.3 million and 32.3 million shares respectively - creating a much stronger layered structure than before.
The SOFI Range That Moved Up by a Full Dollar
The key change in the chart is not just volume, but location. Two weeks ago, the main institutional area was concentrated around $15-$16. Now the dominant zone sits between $16 and $18, with total volume across those three levels reaching roughly 125 million shares.
That creates a much stronger layered structure than what existed in prior sessions, with three separate round-number levels now stacking beneath current price rather than a single pivot point.
Instead of institutions defending price from below a single level, the chart now shows a three-step support zone underneath current trading.
Why $16 Still Matters Most for SOFI Stock
Even with the zone expanding upward, $16 remains the defining level. It holds the largest share concentration on the chart and acts as the institutional base of the current structure. What makes the setup more constructive is that price is trading above the full $16-$18 range rather than inside it.
That changes the read entirely. This is similar to SOFI Stock Anchored at $16 as Dark Pool Battle Over 116 Million Shares Intensifies, where $16 was previously the dominant pivot before the higher shift developed.
The Level SOFI Institutions Left Behind
Just as important as what was added is what disappeared. The chart shows $15 collapsing to only about 430,000 shares - a sharp drop from 28.3 million two weeks earlier. That suggests institutions have largely moved on from that level rather than continuing to treat it as a key area of interest.
The progression from $15-$16 to $16-$17 and now $16-$18 fits a broader pattern already visible in recent SOFI dark pool coverage. In SOFI Stock Trapped Between $16 and $17 as Institutions Stack 161 Million Shares, the stock was described as compressing around a narrower institutional band before the latest expansion higher.
A related example of how institutional zones can define structure also appears in SOFI Tests $13 Support as Bearish Trend Holds Firm, where the focus was on a single lower support area rather than a rising multi-level base.
A Cleaner SOFI Setup Than Prior Sessions
The cleanest feature of the current chart is the stacking effect. Three heavy round-number levels now sit beneath price, total volume has grown, and the entire institutional range has shifted upward week over week. Here is how the current structure breaks down:
- $16 - primary anchor at 65.7 million shares
- $17 - secondary level at 27.3 million shares
- $18 - upper zone at 32.3 million shares
- $15 - largely abandoned, down to roughly 430,000 shares
$16 is the anchor, $17 and $18 reinforce the zone, and price is holding above all of it - making SOFI less a story about short-term volatility and more a story about where institutional support is building.
That does not guarantee immediate upside, but it does create a cleaner structure than anything seen in recent weeks. The question now is whether price can hold above the zone while institutions continue to build their positions.
 Peter Smith