 Eseandre Mordi

⬤ Oracle's stock has been in freefall lately, shedding about 45% in just two months in what's being called an unusually sharp reversal. The daily chart shows ORCL crashing through its 200-day simple moving average as selling pressure builds. The stock is now trading near price levels where it had been consolidating earlier this year.
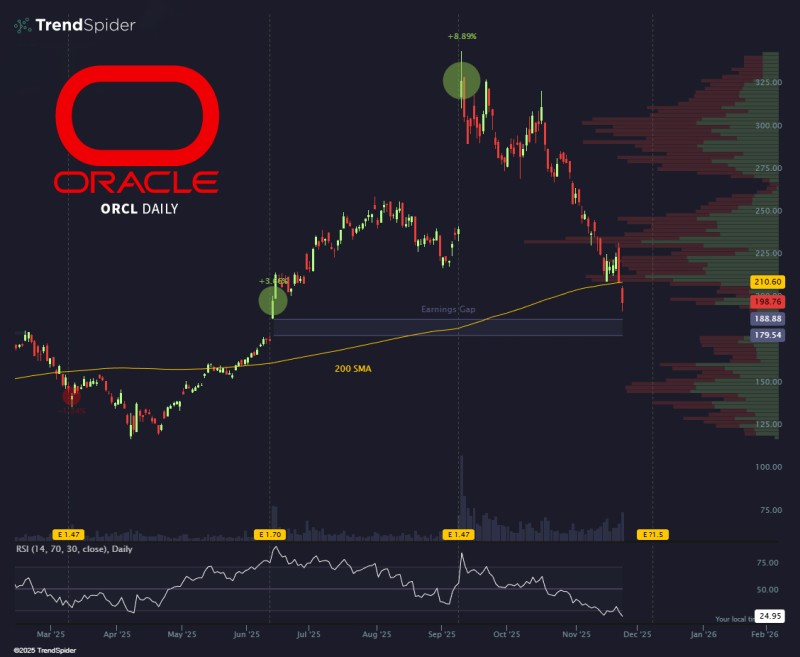
⬤ The chart highlights a huge earnings gap sitting between $175 and $190—a high-volume zone that formed after a strong rally earlier in the cycle. The current selloff has dragged ORCL back toward this area after tumbling from peaks above $325. Previous bounce points are marked on the chart, including gains of 3.64% and 8.89% during earlier rallies. With the 200-day moving average now acting as resistance overhead, the stock is locked in a clear downtrend, while the RSI reading around 24.95 shows deeply oversold territory that matches the recent plunge.
⬤ If ORCL drops far enough to fill that earnings gap, the risk-reward picture could start looking different. The chart shows the ongoing collapse has wiped out a huge chunk of this year's gains, with sellers dominating since earnings season kicked off. Volume profile data on the right side reveals clusters of past trading activity below current prices, pointing to potential zones where momentum could pause if ORCL keeps sliding.
⬤ This rapid breakdown in ORCL's chart structure matters because steep multi-week drops in major enterprise software stocks tend to ripple through related tech sectors. When a stock breaks decisively through long-term moving averages, it usually forces traders to rethink trend stability and whether earlier gains can hold. With ORCL now closing in on a key historical trading zone and that visible earnings gap, what happens next could play a big role in shaping expectations around volatility, potential recovery, and broader sector sentiment.
 Eseandre Mordi


