 Peter Smith

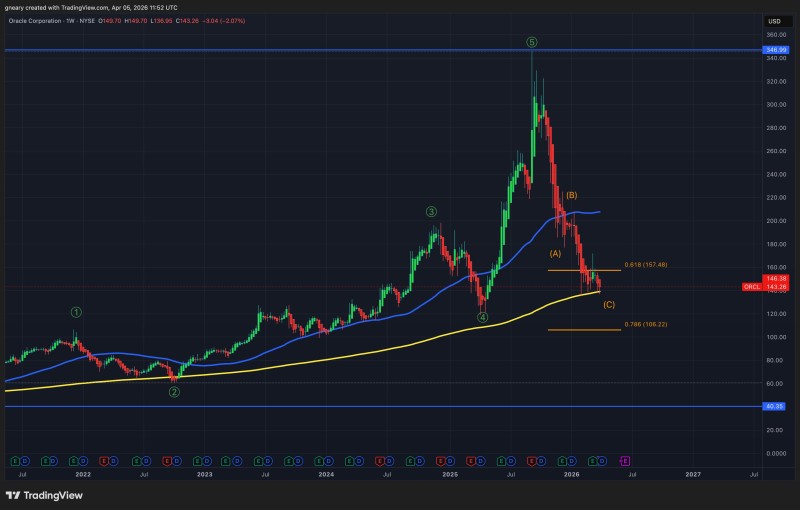
Oracle has entered a decisive phase following a sharp decline from its highs, with price now consolidating near a major long-term level. The Long Investor pointed out that ORCL has been holding its 200-week moving average for several weeks, with price currently around $143 and directly testing this support zone.
The broader context matters here. ORCL crashed nearly 45% in 60 days before reaching this inflection point - a drop sharp enough to bring price back into contact with a level it had not interacted with in years.
The Level That Defines ORCL's Long-Term Structure
The 200-week moving average is the central feature of the current chart, acting as a long-term support zone. Price has remained around this level for multiple weeks, showing that selling pressure has slowed as the stock interacts with a historically significant trend indicator.
ORCL is not breaking down aggressively - it is holding support. This is the boundary between long-term trend continuation and deeper correction.
This zone is not just another support line. It represents the threshold between a long-term uptrend remaining structurally intact and a more serious breakdown into deeper corrective territory. How price responds here will carry consequences well beyond the short-term timeframe.
A Correction That Reset the ORCL Price Structure
The chart reflects a strong prior rally followed by a clear corrective phase. Price has retraced significantly and is now positioned near the 200 WMA rather than extended above it. This reflects a structural reset rather than simple continuation of the previous trend.
Instead of chasing highs, the market has returned price to a level where it interacts with long-term averages - a reset that historically precedes the next sustained move.
Similar pullbacks in ORCL have previously led to stabilization phases where price consolidates after a sharp decline before the next directional move develops. The current setup fits that pattern closely.
Where ORCL Price Is Being Repriced at $143
At approximately $143, ORCL is sitting directly on support with no strong directional move yet confirmed. The chart does not show a breakout or reversal - it shows holding behavior. That distinction matters significantly.
The setup is not about immediate upside. It is about whether the level continues to hold under sustained selling pressure. Recent analysis of Oracle stock movements shows that after sharp declines, price often pauses and consolidates near support before any sustained move develops.
After sharp declines, price often pauses near support before determining direction. The 200 WMA is where that pause is happening right now.
The Decision Point Following a Sharp ORCL Drop
The structure is now simplified around one key idea: support holding versus support breaking. There are no additional signals beyond this level - the analysis focuses entirely on positioning.
- Holding the 200 WMA keeps the long-term structure intact
- Losing it would shift the market into a deeper corrective phase
At this stage, ORCL is not trending - it is stabilizing. And in technical terms, stabilization at a major moving average is precisely where the next trend typically begins. The level is clear, the stakes are defined, and price is sitting right at the decision point.
 Peter Smith


