Peter Smith

Nvidia stock is currently navigating a critical technical pattern that could determine its next major move. The chip giant has formed a rising wedge on shorter timeframes following a sharp decline, creating a setup that traders are watching closely for signs of either continuation or reversal. The current consolidation between tightening trendlines suggests the market is preparing for a decisive break in either direction.
Rising Wedge Formation Signals Potential Direction
Nvidia is currently trading inside a rising wedge formation on the hourly chart, a structure that often appears as a bear flag after a sharp decline. The chart shows NVDA attempting to stabilize following a strong drop, with price forming a sequence of higher lows within narrowing trendlines. As analysts reported, the current pattern suggests that Nvidia may first push slightly higher before the market decides whether to resume the broader downtrend or break out to the upside.
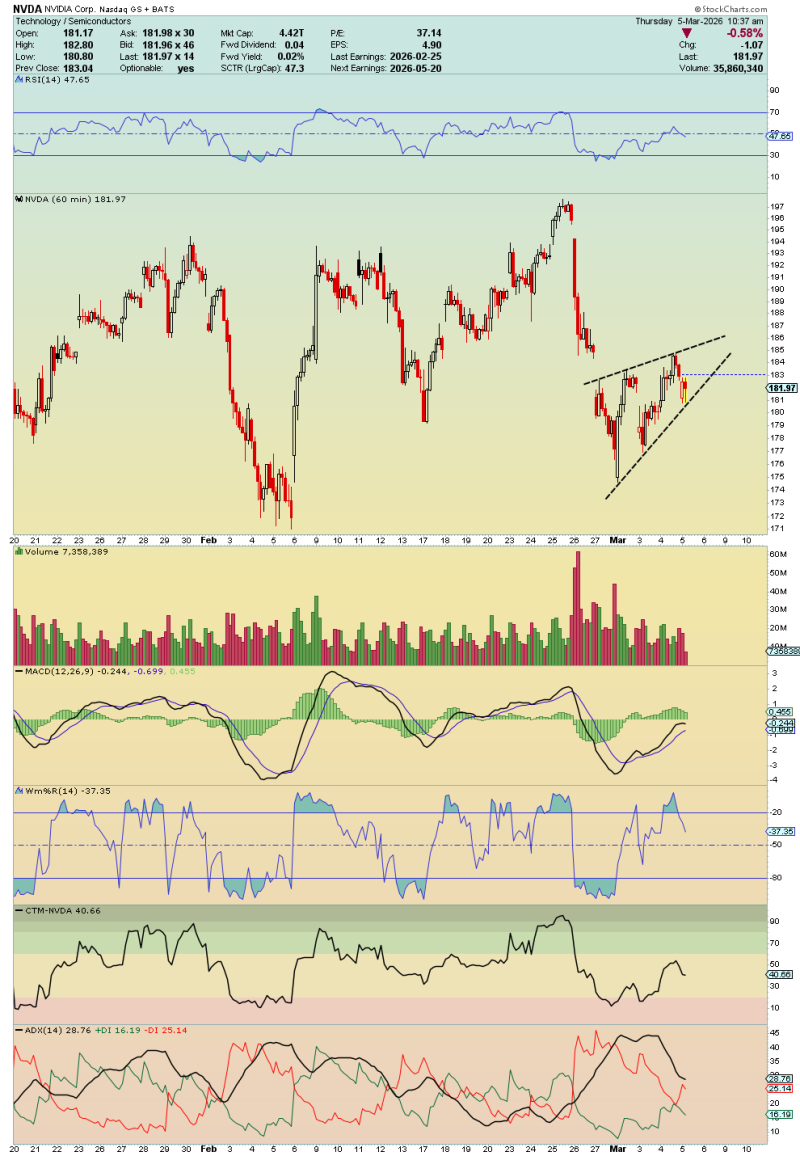
The technical setup highlights a classic consolidation after a sharp selloff. NVDA previously dropped quickly from recent highs before entering a tightening price structure that slopes upward. This type of formation frequently acts as a bear flag, where the market temporarily rebounds before another potential leg lower. Technical analysis from NVDA Stock Targets $200 After Technical Rebound shows that similar support zones can trigger recovery moves toward higher resistance levels when buyers successfully defend key areas.
Key Price Levels Between $186 and $192
If Nvidia continues its current rebound, the next technical target could be the upper boundary of the wedge near the $186-$187 region. This area represents the immediate resistance level that traders are watching closely. The chart also shows a clear support area where price formed a short-term double bottom, indicating that buyers are currently defending the zone and slowing the downside momentum.
The next move from this structure could determine the short-term direction for NVDA. If the stock rejects resistance near the wedge top, the bear flag pattern may remain valid and lead to another sharp decline. However, if price breaks above the upper trendline, the bearish formation would be invalidated and momentum could accelerate higher. In that scenario, recent analysis from NVDA Holds $185 Support Level, Eyes Final Rally Before Potential Correction suggests a rapid move toward the $192 area could develop as the market shifts into a stronger bullish phase.
Broader technical context also shows NVDA repeatedly consolidating near key levels before major moves. Market observers at NVDA Forms Weekly Ascending Triangle Between $186-$194 have pointed to similar compression patterns before directional breakouts, reinforcing the importance of watching how price behaves at these critical boundaries in the coming sessions.
 Peter Smith