 Saad Ullah
⬤ Nvidia stock is consolidating near $190 after its earlier rally, forming what traders call an ascending triangle on the weekly chart. The pattern shows price bouncing off a rising support line while repeatedly hitting resistance at the same level. Instead of breaking out in either direction, the stock is compressing inside this tightening range.
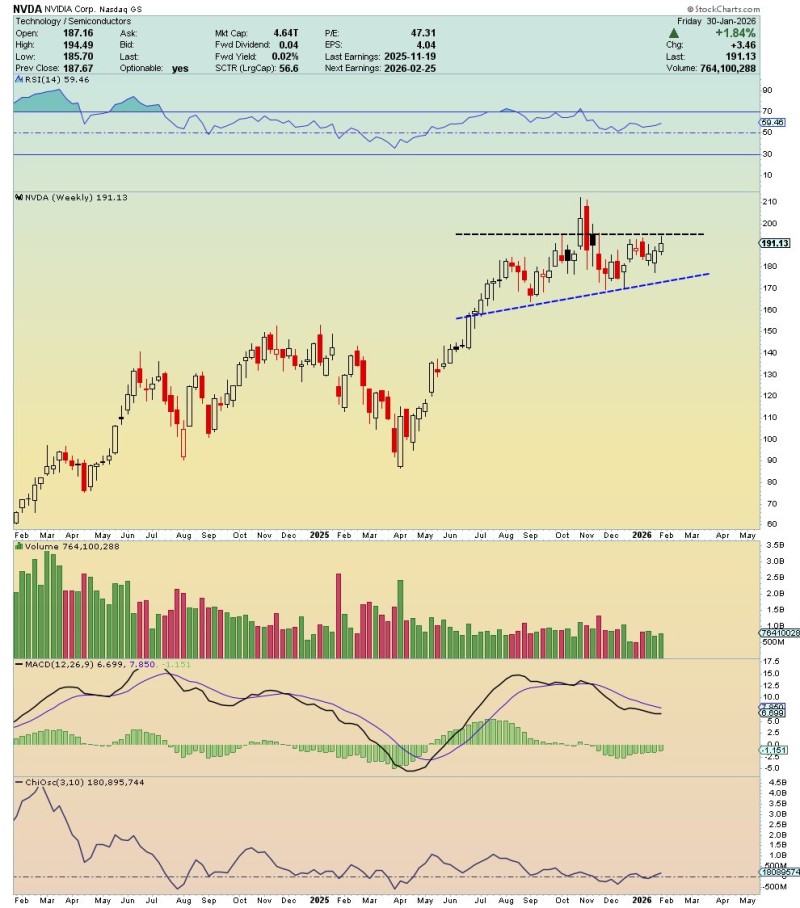
⬤ Two price levels are defining Nvidia's current trading range. Support sits around $186, matching the rising trendline on the weekly timeframe. Resistance holds firm at $194, where multiple breakout attempts have failed. The stock remains stuck between these zones as the market shows signs of hesitation.
⬤ Technical indicators suggest consolidation rather than momentum in either direction. The weekly RSI hovers near neutral territory, avoiding overbought levels despite the previous rally. Volume has dropped compared to earlier moves, typical of a trend pause. The setup points toward continued volatility as earnings approach.
⬤ Given Nvidia's weight in the semiconductor and tech sectors, this pattern matters beyond the stock itself. A clean break above $194 would confirm the triangle and signal renewed buying momentum. Dropping below $186 would break the structure and open the door to further downside. Whichever direction it moves, the resolution could influence sentiment across growth stocks.
 Saad Ullah


