 Eseandre Mordi
⬤ Nvidia has successfully defended important support at the lower boundary of its rising wedge pattern, setting up the stock for what could be a final rally in 2026 before a broader market pullback. The support level at the wedge's base has proven resilient, strengthening the case for near-term upside momentum.
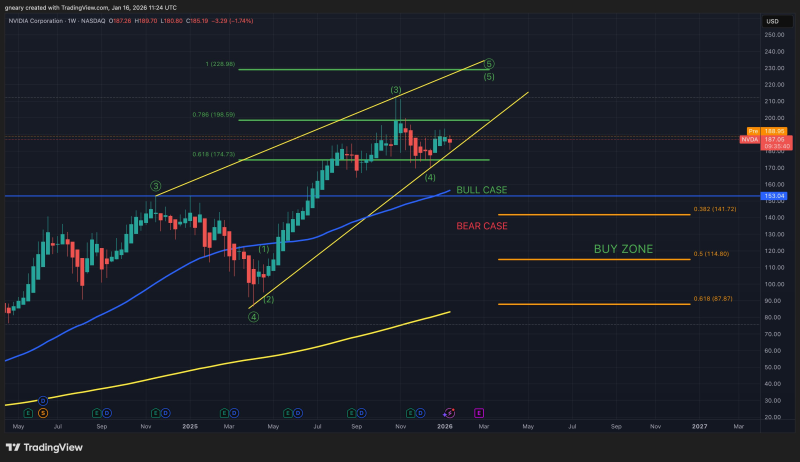
⬤ What makes this support level particularly significant is the convergence of two major technical markers: the 200-week moving average aligning perfectly with the 0.618 Fibonacci retracement level. This type of technical confluence typically creates a powerful support zone. With NVDA currently trading around $185, this area could serve as a launching pad for the next leg higher if the support continues to hold.
⬤ The combination of the rising wedge formation and the 200-week MA/Fibonacci support confluence suggests Nvidia might lead the market forward in the coming months. That said, once the wedge pattern completes, there's a real possibility of a market correction following. Right now, NVDA faces a critical test, and traders are keeping a close eye on how price action unfolds around this support zone.
⬤ The next few weeks will be telling. If Nvidia can maintain support at these levels, it strengthens the bullish case and could fuel another rally. But if this support crumbles, we might see a broader market pullback take hold. Traders are watching closely for any signs of a breakout above resistance or a breakdown below these key technical levels.
 Eseandre Mordi


