 Alex Dudov
As Nvidia prepares for its upcoming quarterly earnings announcement, the stock finds itself at a technically significant crossroads. Trading around $197.22, NVDA has pulled back into the 0.618 Fibonacci retracement level - a zone technical traders call the golden ratio. This isn't just any support level. The same price area acted as a ceiling during 2025's rally attempt, making the current test particularly noteworthy for investors watching the chip giant's next move.
Why the 0.618 Fibonacci Level Matters for NVDA Stock
The golden ratio near $195.90 represents more than a mathematical curiosity. Chart patterns show Nvidia previously failed at this exact Fibonacci level in 2025, triggering a pullback that stalled the stock's upward momentum. Now, in 2026, NVDA is retesting this barrier after retreating from recent highs, creating a make-or-break scenario just as earnings approach.
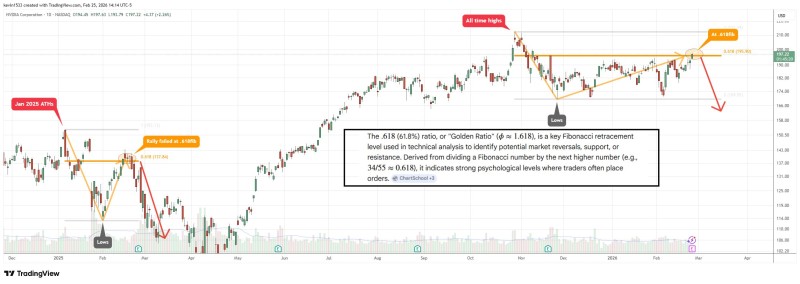
Technical traders monitor the 0.618 retracement because it sits between major swing points where buying and selling pressure often concentrates. This psychological threshold frequently determines whether trends continue or reverse, making it a widely watched line in the sand for institutional and retail traders alike.
Historical Context Shows Pattern Recognition
Nvidia's price history demonstrates clear sensitivity to Fibonacci levels during both rallies and corrections. This technical corridor often precedes significant breakouts or reversals, adding weight to the current golden ratio test.
The interaction between NVDA and the 0.618 level carries implications beyond simple chart patterns. A decisive break above this resistance, sustained through the earnings release, could signal renewed bullish momentum and attract momentum buyers. Conversely, rejection at this familiar ceiling might trigger consolidation or corrective selling pressure, similar to what occurred in 2025.
As markets await Nvidia's corporate catalyst, the golden ratio's dual role as both support and resistance makes it a critical reference point for understanding the stock's near-term trajectory and potential post-earnings direction.
 Alex Dudov


