 Eseandre Mordi
Nvidia stock has entered a critical consolidation phase, trading within a narrow technical corridor that's becoming increasingly compressed. The chip giant's shares are now caught between important Fibonacci resistance and support levels while Ichimoku cloud indicators show momentum tightening—a setup that often signals an imminent breakout.
NVDA Stock Consolidates Between Key $175 to $193 Technical Levels
Nvidia continues trading in a well-defined consolidation band as price action stalls near crucial technical boundaries. NVDA is currently ranging between the 1.236 and 1.414 logarithmic Fibonacci levels at $175.71 and $193.87. Chart patterns show repeated weekly candles forming inside this zone, creating a sideways structure rather than any sustained trend movement.
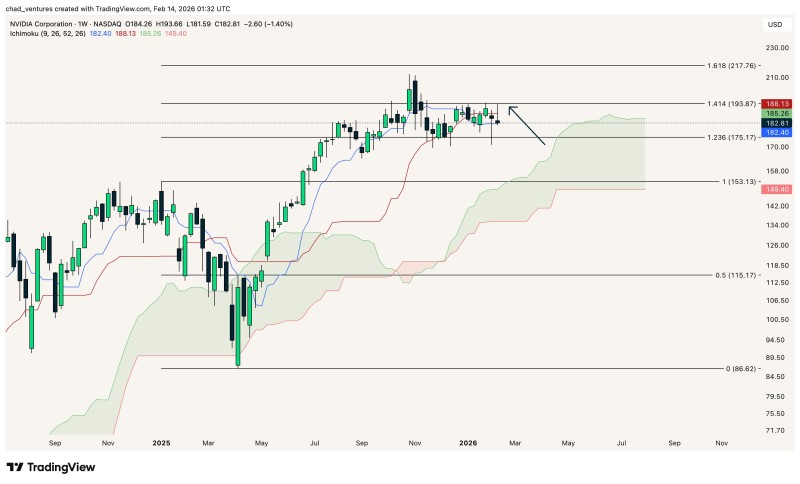
The compression has intensified as NVDA becomes stuck between the weekly Tenkan line (blue) and Kijun line (red). Candles are repeatedly bouncing between both Ichimoku lines, indicating limited directional momentum as the market awaits resolution. This technical setup highlights how precisely defined this consolidation zone has become.
Similar tightening behavior was previously observed in Nvidia stock consolidates near $189, while broader consolidation patterns emerged when NVDA stock holds steady after $200 resistance test.
What Nvidia's Tightening Range Means for Traders
Price remains positioned above the Ichimoku cloud but continues failing to break through the Fibonacci ceiling near $193.87. The lower boundary around $175.71 serves as the key support reference, while the upper boundary marks the resistance that's capped recent upward attempts. Comparable resistance dynamics appeared when NVDA tests $192 to $193 resistance after reclaiming 50-day average.
This setup matters because tightening ranges typically precede stronger directional moves once price escapes the compression zone. With NVDA constrained by both Fibonacci boundaries and the Tenkan-Kijun range, a decisive break above $193.87 or below $175.71 would signal the consolidation phase has resolved and trigger the next significant trend direction.
Traders should watch these levels closely as volatility often expands sharply after extended periods of compression.
 Eseandre Mordi


