 Usman Salis
Nvidia's back in the spotlight, and this time it's all about whether the stock can hold its ground at some pretty crucial levels. After getting knocked around recently, NVDA is sitting right where traders love to see it—at a make-or-break technical zone that could launch the next big move. With earnings lurking just around the corner, things are about to get interesting.
NVDA Price at Critical Fibonacci Levels
Here's where it gets technical but exciting. Trader @Desi_Trade spotted something juicy: NVDA's recent pullback has landed right at the 50% Fibonacci retracement level around $23,452. This isn't just any random number—it's perfectly aligned with Wednesday's highs, creating what traders call a "confluence zone."
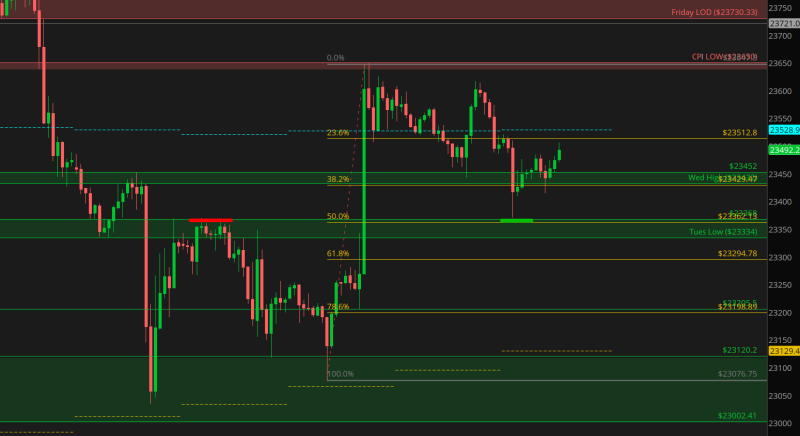
Think of it like this: when multiple technical signals point to the same price level, it's like having several alarm bells going off at once. The stock has bounced off similar zones before, and now we're getting a retest of this critical area.
If NVDA can plant its feet here and hold firm, we might be looking at a textbook setup that could send the stock climbing higher. It's the kind of technical pattern that gets day traders and institutions alike paying attention.
Technical Outlook for NVDA Price
Right now, NVDA is trading around $181.56, and the next big test comes at $23,528.9 resistance. Break above that level, and we could see some real momentum building. But here's the catch—if the stock can't hold above $23,334 (that's Tuesday's low), things could get ugly fast.
A breakdown below that support could open the door to $23,120, and if the selling really picks up steam, $23,002 becomes the next target. It's a classic risk-reward setup where the next few trading sessions could make or break the short-term outlook.
The bigger picture is all about earnings expectations. Nvidia's been the poster child for the AI revolution, so whatever happens with this stock tends to ripple through the entire tech sector. That's why these technical levels matter so much right now.
 Usman Salis


