 Saad Ullah

⬤ Nvidia is moving through a tightening consolidation phase on the daily chart, forming an ascending triangle just below resistance. Price is hovering around $183-$185, close to the apex of the structure where breakouts typically resolve. According to Banana3, this pattern is developing after a prior uptrend, which raises the probability of an upward move if momentum returns.
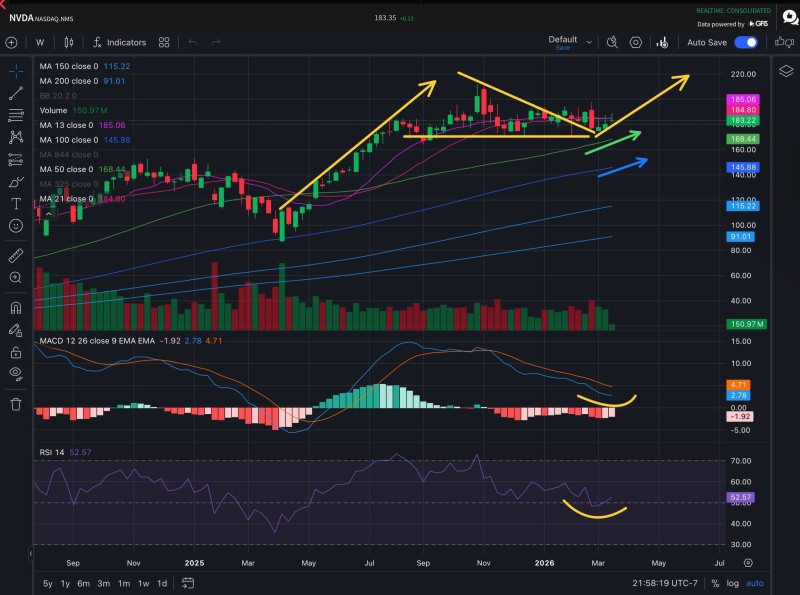
⬤ NVDA is holding above its upward-sloping 50-day moving average, a sign that the intermediate trend remains intact. Volume has stayed low during consolidation, which is common in basing setups before a larger expansion. The technical structure points toward $220 as the next significant resistance level, consistent with earlier projections in NVDA Stock Targets $200 After Technical Rebound and the NVDA Range Tightens Between $175.71 and $193.87 Breakout Zone analysis.
The longer the base, the higher the space. As long as price holds above the rising 50-day moving average, the broader trend remains bullish and a breakout toward higher levels becomes increasingly likely.
⬤ Momentum indicators are resetting rather than breaking down. RSI is stabilizing near 50, while MACD is showing early hints of a bullish turn after a period of decline. That said, NVDA still trades below the 13 EMA and 21 SMA, both of which are acting as short-term resistance. A reclaim of these averages would sharply improve the bullish case and align with broader targets covered in NVDA News: Nvidia Targets $230 as Chart Highlights $167 Support Retest.
⬤ This setup places Nvidia at a key technical inflection point where consolidation, trend continuation, and momentum reset all converge. How this pattern resolves could shape broader sentiment across semiconductor stocks, given NVDA's role as a central driver of the AI-related equity narrative.
 Saad Ullah


