 Marina Lyubimova

⬤ Nvidia (NVDA) is drawing attention after commentary flagged a growing gap between improving fundamentals and a stock price that has gone essentially nowhere for roughly half a year. According to a recent analysis of Nvidia's revenue jump to $215.9B, revenue and earnings are significantly higher, with analysts projecting around 49% growth over the next twelve months. The current pause is being read as a consolidation phase, not a breakdown.
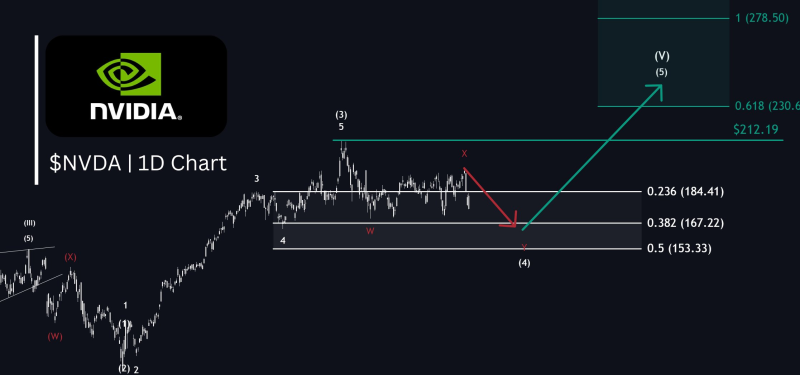
⬤ The chart in focus uses Fibonacci retracements to map a range of downside reference points. The primary support level sits at $167.22 (the 0.382 retracement), flagged as a likely retest zone. Above it, $184.41 (0.236) acts as an interim level, while $153.33 (0.5) marks deeper support if selling accelerates. A horizontal reference near $212.19 is also annotated above current price action as a nearby resistance line, though not a confirmed breakout level.
The $167 support and $230 target are the primary levels highlighted in the setup, with commentary describing the move as a potential squeeze if support holds.
⬤ The projected path, as outlined in NVDA's $175-$197 band analysis, calls for a final dip into the $167 region before a recovery push toward the 0.618 Fibonacci level near $230.60. That would represent roughly a 38% move from the support zone if the setup plays out as mapped.
⬤ Nvidia's price action carries weight beyond the single stock. As a bellwether for the semiconductor and AI hardware complex, extended consolidation in NVDA tends to set the tone for large-cap AI-linked equities broadly. With $206.88 flagged as a gap fill target in related technical work, how price reacts around $167 in the near term may well determine whether the next leg is a squeeze higher or a deeper reset.
 Marina Lyubimova


