 Marina Lyubimova

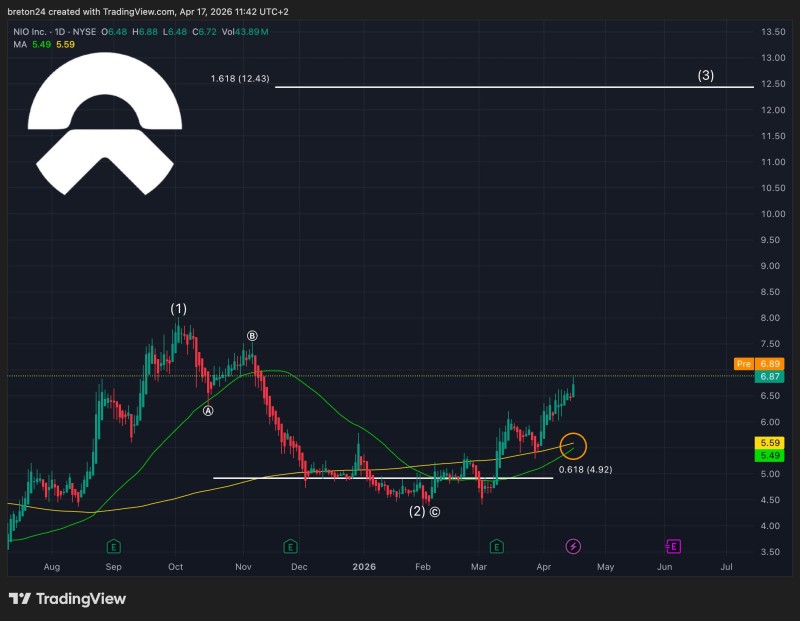
NIO is showing early signs of a bullish setup as price continues to push higher within an emerging technical structure. According to StockChaser, the stock is approaching a golden cross while trading within a wave (3) formation, with attention now shifting to a critical resistance zone.
The chart shows NIO recovering from earlier lows and forming a steady upward move into the $6.50 - $7.00 range. The structure includes labeled wave progression, with price currently positioned within wave (3), as indicated directly on the chart. There is no confirmed breakout yet - price remains below the key resistance zone highlighted in the analysis.
The stock is approaching a golden cross while trading within a wave (3) structure, with attention now shifting to a critical resistance zone.
NIO Stock: the Moving Average Signal to Watch
A golden cross is forming, with the shorter-term moving average rising toward the longer-term one. This is clearly visible on the chart and aligns directly with the published outlook. Price is already trading above both moving averages, reinforcing short-term bullish positioning - but the crossover itself has not fully confirmed yet.
For context on how NIO has behaved around similar technical setups in the past, see this earlier breakdown: NIO Stock Analysis: Break Above $5.40 Could Signal Bullish Shift.
Price is already trading above both moving averages, reinforcing short-term bullish positioning, but the crossover itself has not fully confirmed yet.
NIO Stock Resistance: the $7.50 - $8.00 Zone That Matters Most
The analysis explicitly highlights the $7.50 - $8.00 zone as the key resistance area. This aligns with the chart structure, where prior highs and rejection zones cluster in that range. A break above this level is required to unlock further momentum - without it, price remains in a developing setup rather than a confirmed breakout.
The weekly structure leading into this resistance is explored in more detail here: NIO Stock Price Analysis: NIO Targets $8.20 as Weekly Base Forms.
NIO Fibonacci Target at $12.43: What the Chart Projects
The chart shows a 1.618 Fibonacci extension at $12.43, explicitly mentioned as the projected target. This level represents the upside scenario only if price successfully breaks and holds above the $7.50 - $8.00 resistance zone.
The $12.43 Fibonacci extension target is only unlocked if price successfully breaks and holds above the $7.50 - $8.00 resistance zone.
For a broader view of where NIO has struggled on longer timeframes, this piece provides useful context: NIO Stock Analysis: Monthly Trend Stays Bearish After Failing to Break $5.30.
 Marina Lyubimova


