 Eseandre Mordi

NIO stock is still stuck in a bearish technical structure. After failing to push through the critical $5.30 resistance on the monthly chart, the price sits around $4.87, with long-term downtrend bands pressing from above and support zones holding below. The monthly setup continues to show downward pressure, though some recent price action may be hinting at a shift.
Multi-Year Decline: $5.30 and $7.71 Act as Key Overhead Resistance
Zoom out on the monthly chart and the story is clear. NIO peaked sharply around 2021, then spent most of 2022 and 2023 in a steady grind lower. The trend bands stayed red throughout, and every attempted recovery ran into lower highs. Right now, the main overhead resistance cluster sits between $5.30 and $7.71, where prior peaks piled up. On the downside, a green support zone near the low $3 area has previously served as a base during consolidation, and it remains a level worth watching.
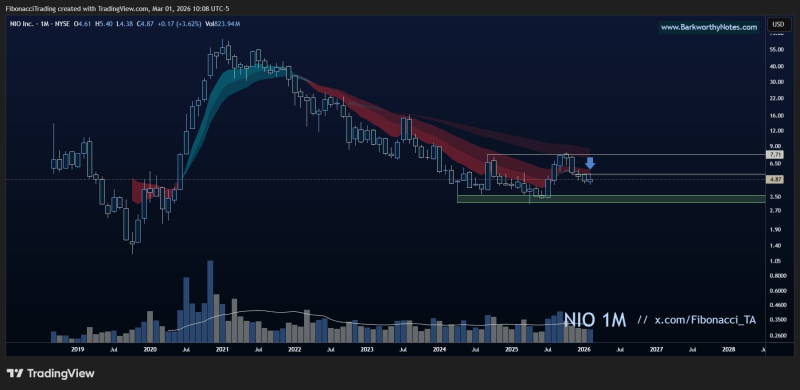
Could a Higher Low Signal the Start of a Trend Shift?
Despite the gloomy big-picture view, there's one detail catching attention: the possibility of a higher low forming on the monthly chart, something that hasn't been clearly visible in recent cycles. If NIO manages to hold above its most recent trough without printing a new low, it could be an early signal that selling pressure is starting to ease. Still, without a clean, sustained close above $5.30, the broader downtrend remains in control.
This kind of drawn-out consolidation isn't unusual for EV stocks. Extended periods of base-building often precede meaningful trend reversals, but they require confirmation. As NIO has posted three straight monthly gains recently, some bulls are watching closely. The tension between stubborn overhead resistance, a firm support floor, and the emerging structural signals will likely continue to define how traders position around NIO in the months ahead.
 Eseandre Mordi


