 Alex Dudov

⬤ NIO is getting close to an important technical level near $5.40, where a breakout could bring back bullish momentum. Weekly close above $5.40 would flip the structure back in favor of bulls after months of sideways movement. The weekly TradingView chart shows NIO trading around $5.07, stuck below this key resistance after bouncing from lower support areas.
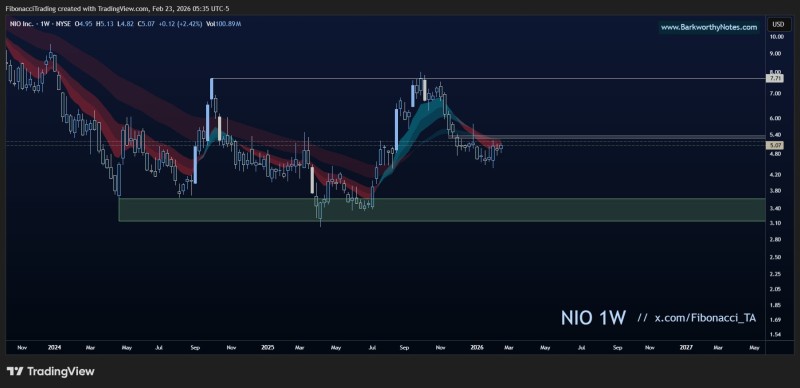
⬤ Over the past few months, NIO stock has been holding steady around the $4.80-$5.00 range, building a base after dropping from highs above $7.70 earlier in 2025. Traders note that this zone lines up with key Fibonacci retracement levels, especially support near the Golden Pocket around $4.77 to $4.93. This support band has kept downside pressure in check and let price consolidate before testing the $5.40 resistance. Recent analysis has pointed out similar consolidation patterns near the $5 mark and the broader trendline setups that could influence breakout potential.
⬤ A breakout above $5.40 could clear the way toward higher resistance levels near $7.70 and beyond, matching scenarios where NIO targets $8.20 as weekly base forms. Current technical analysis suggests that if NIO holds above $5.40 with solid volume, it would show a shift in market structure favoring upward movement. On the flip side, if NIO can't push past this barrier, price may stay range-bound, continuing to bounce between support and resistance inside the current channel.
⬤ What happens around the $5.40 resistance carries bigger implications for NIO's trend direction. A clean breakout above this zone could signal fresh bullish momentum after a long stretch of consolidation. Successfully reclaiming this level might shift sentiment toward a more positive outlook, while rejection would highlight the ongoing importance of lower support zones in shaping the stock's next move. The weekly trendline break points to upside after $15 high scenario remains in focus for traders watching this key level.
 Alex Dudov


