 Eseandre Mordi
⬤ Netflix (NFLX) is showing some of its worst technical damage in years. The stock is now trading sharply below its 200-day moving average, with the gap stretching beyond 30% - a level of divergence rarely seen in the stock's recent history. At roughly $76 per share versus a 200DMA sitting near $110.7, the breakdown is hard to ignore. Netflix Stock Drops 18% Below 200-Day Average - Widest Gap in 3+ Years - and things have only gotten worse since that reading.
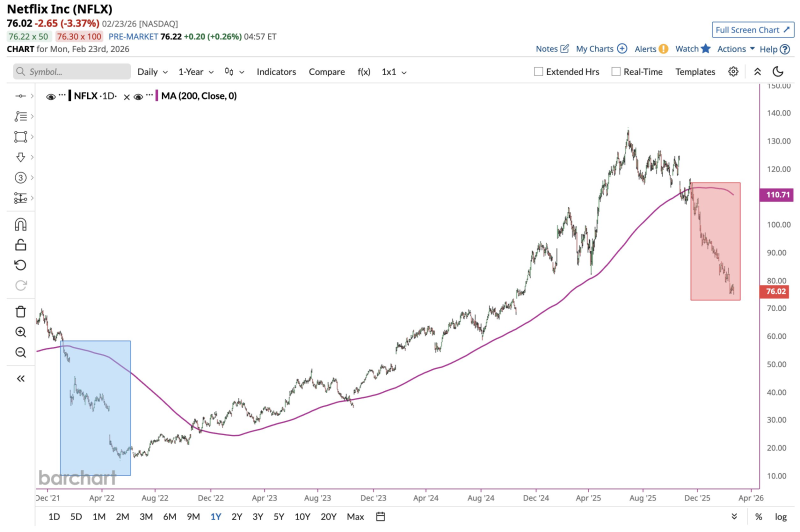
⬤ The selling has been relentless. After spending much of 2023 and 2024 comfortably above the 200-day line, NFLX has reversed hard, with support around the $80 zone coming under serious pressure. Weekly momentum indicators remain deeply negative, and the stock has racked up an extended streak of losing sessions. The data backs that view - Netflix Holds $82 Support Level as Stock Shows 30% Decline from Moving Average, but that floor is looking fragile.
⬤ Breaks this deep below a major moving average don't happen quietly. The 200DMA is one of the most widely watched trend benchmarks in technical analysis, and when a high-profile name like NFLX falls this far below it, market participants tend to reassess the entire trend structure. Oversold readings on weekly charts suggest conviction behind the selling rather than panic noise. Netflix Stock Hits 9-Week Losing Streak as Price Sweeps $80 Support - a streak that signals this correction runs deeper than short-term volatility.
⬤ How Netflix behaves around current support levels will define the next chapter. Whether the stock stabilizes and begins rebuilding toward its long-term average, or continues lower, will carry implications not just for NFLX holders but for broader sentiment around media and tech growth stocks.
 Eseandre Mordi


