 Marina Lyubimova
⬤ Netflix (NFLX) is now trading 18% below its 200-day moving average – the widest gap in over three years. The stock is changing hands around $94, while the 200-day average hovers above $113. This marks a sharp reversal for a company that spent most of 2023 and 2024 riding comfortably above that trend line.
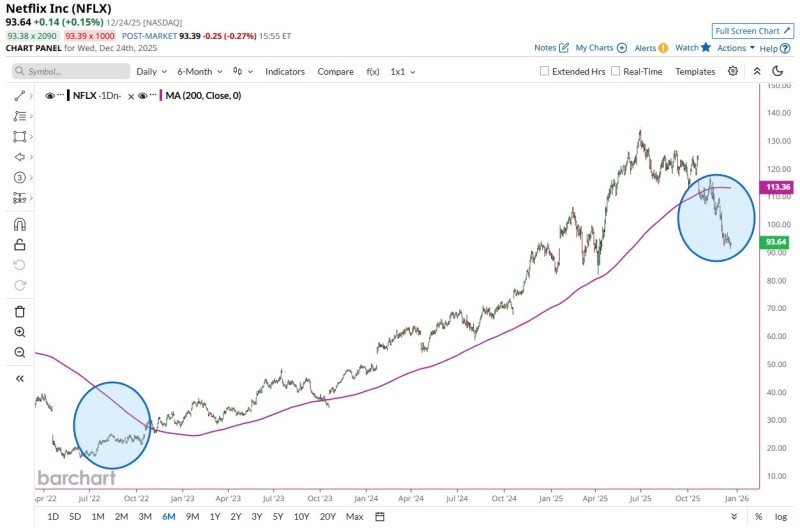
⬤ The chart shows two key moments. Back in 2022, Netflix stabilized near the 200-day line before launching into a multi-quarter rally. Now, the recent circle on the right shows the stock tumbling well below that same benchmark. The purple trend line keeps climbing while the actual price has fallen away, creating that notable 18% gap. It's a visual reminder of how quickly momentum can shift – Netflix went from trending strongly upward to breaking down below its long-term support.
⬤ For most of last year and into early 2025, NFLX traded above the 200-day line without much trouble. Then something changed. The stock recently closed near $93.64, compared to the moving average sitting at $113.36. That's a significant spread for a stock that Wall Street watches closely as a streaming and growth bellwether.
⬤ Why does this matter? The 200-day moving average is one of those indicators traders use to gauge whether a stock is in a healthy uptrend or losing steam. When a major name like Netflix falls this far below it, it often signals underlying weakness or a shift in investor sentiment. The fact that this is the biggest divergence since the downturn shown on the left side of the chart makes it even more noteworthy for anyone tracking NFLX.
 Marina Lyubimova


