 Alex Dudov
⬤ Netflix stock is stuck in a brutal slide, racking up nine consecutive weekly losses as sellers keep piling on. The streaming giant just crashed through its April lows around $80, confirming that a critical support zone has completely given way. The weekly chart tells the story clearly—each close lower than the last, with no sign of buyers stepping in to defend these levels.
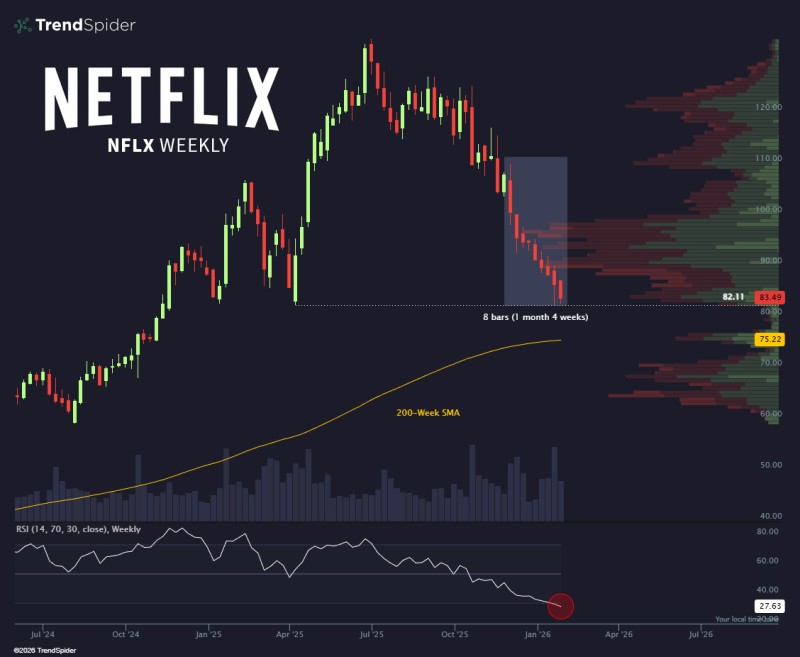
⬤ This breakdown didn't happen overnight. The selling has played out over roughly eight weeks, which translates to about a month and a week of steady downward pressure. Price action has methodically ground lower into the low $80s, where the most recent weekly bar closed. The consistent volume throughout this move shows real conviction behind the selling—this isn't some thin, erratic drop but a sustained shift in sentiment.
⬤ The momentum picture looks equally grim. Netflix's weekly RSI has crashed to levels not seen since 2022, flashing deeply oversold conditions by any historical measure. "The prolonged decline has now swept the April lows, confirming that a key support area has failed," according to market analysis platform TrendSpider. That said, the 200-week moving average continues trending higher below current prices and hasn't been tested yet during this selloff.
⬤ Netflix now sits at a make-or-break technical spot. With April support gone and momentum indicators screaming oversold, how the stock behaves around these $80 levels could set the tone for the broader tech sector. After nine straight weeks of losses, NFLX has become a real-time case study in what happens when downside momentum takes full control of a major growth stock.
 Alex Dudov


