 Marina Lyubimova

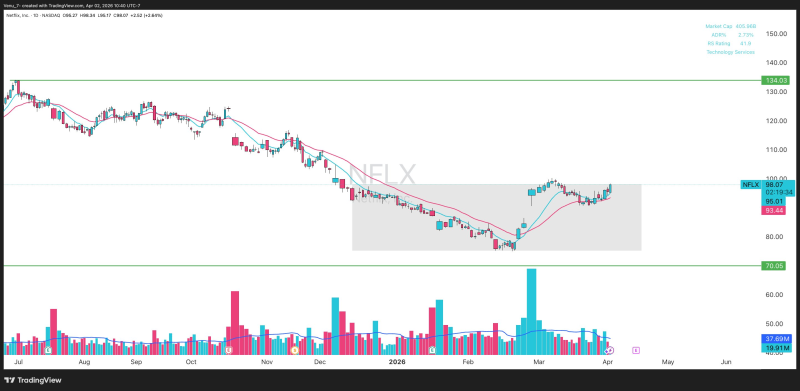
Netflix is showing a notable shift in technical structure after a period of weakness, with recent price action reclaiming key levels and stabilizing above short-term support. The chart reflects a clean sequence of a gap-up move, a controlled pullback, and continued strength - positioning NFLX for a test of a critical resistance zone.
The NFLX Shift That Signals Early Leadership
The chart shows that Netflix was among the earlier names to weaken, but it is now transitioning into recovery. After forming a base near the lows, price moved sharply higher, creating a visible gap and breaking the prior pattern of downside continuation.
Netflix was among the first to weaken - and it may now be among the first to lead a broader move higher, a distinction that matters in a market still searching for direction.
As Venu noted, this early shift in structure raises the possibility that NFLX could be among the first to lead a broader move higher - a meaningful distinction in an environment where most names are still struggling to stabilize.
The NFLX Moving Average Reclaim That Changes the Structure
The defining feature of the current setup is the reclaim of key moving averages. After the initial rally, price pulled back and successfully held the 21-day EMA, confirming it as support. From there, the structure continued to improve:
- Price held above the 21-day EMA after the pullback
- The 50-day and 100-day simple moving averages were reclaimed
- Consolidation formed above these levels rather than breaking below
This sequence reflects controlled price action, where buyers are maintaining support instead of losing momentum after the initial move. Netflix Holds $82 Support Level as Stock Shows 30% Decline From Moving Average marked the low point of that weakness phase - providing context for just how far NFLX has traveled to reach the current technical position.
The $107 Barrier That Now Defines NFLX's Next Move
With price stabilizing above key averages, attention shifts to the major resistance near $107, which aligns with the 200-day moving average and makes it a technically significant zone. The chart shows price currently trading below this area, leaving room for continuation if momentum holds.
The $107 zone aligns with the 200-day moving average - prior NFLX moves have struggled around major long-term averages, and this test is unlikely to be any different.
Netflix Stock Drops 18% Below 200-Day Average (Widest Gap in 3 Years) documented how extended the gap became at the lows - which is precisely why the current approach toward the 200DMA from below represents such a significant test of whether the recovery has real substance behind it.
Netflix Stock Breaks $100s Support: 4-Year Cycle Peak Confirmed at July 2025 High adds longer-term context, showing how major levels in NFLX have historically defined multi-month direction once tested with conviction.
 Marina Lyubimova


