Artem Voloskovets

⬤Microsoft is approaching a critical technical zone after pulling back from its recent high near $555. The stock is now testing the 34-week and 50-week simple moving averages, a support region that has repeatedly acted as a reversal point over the past 14+ years. Traders closely follow this area as a historically significant level for the stock's long-term trend.
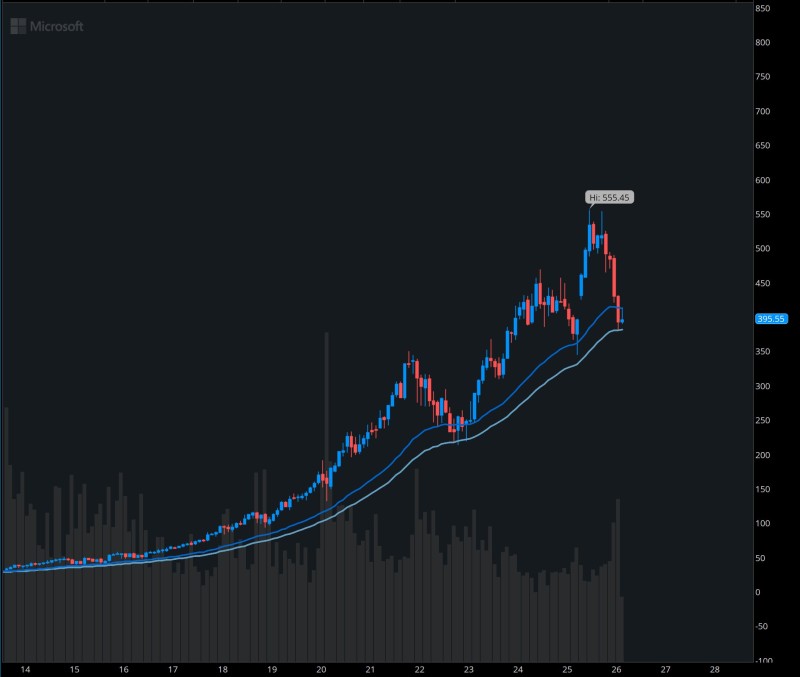
⬤After rallying above $550, MSFT retraced roughly 31%, bringing price down toward key moving-average support. This zone aligns with a broader pattern where large-cap tech stocks tend to stabilize during cyclical corrections before resuming their primary trend. MSFT Stock Extends Bullish Sequence Toward $600 Target outlines how prior recoveries from similar setups have historically preceded new highs for the stock.
⬤Microsoft has repeatedly respected long-term moving averages during corrections, with buyers historically stepping in before the stock could close decisively below these levels. MSFT Touches 200-Week Moving Average for Only the 3rd Time in 13 Years shows how rare and significant that test was, with prior instances preceding strong recoveries each time.
⬤The broader outlook for MSFT depends on how the stock reacts around this support zone. Long-term moving averages often serve as key decision points where the market determines whether a correction deepens or stabilizes ahead of the next leg higher. Microsoft Tests Critical $380 Fibonacci Support reinforces how this cluster of technical levels continues to define risk and opportunity for the stock near current prices.
 Artem Voloskovets