Usman Salis

META stock is approaching a critical turning point as price action aligns with a completed Elliott Wave corrective pattern. The stock has entered a buying area following a 7-swing correction, according to Elliottwave Forecast - an inflection that often precedes the next directional move.
META Stock Completes W-X-Y Corrective Phase From $780-$800 Peak
The chart shows META finishing a complex W-X-Y corrective phase after peaking near the $780-$800 region. The decline into 2026 unfolds as a multi-leg structure rather than a sharp impulsive selloff, reinforcing its corrective nature.
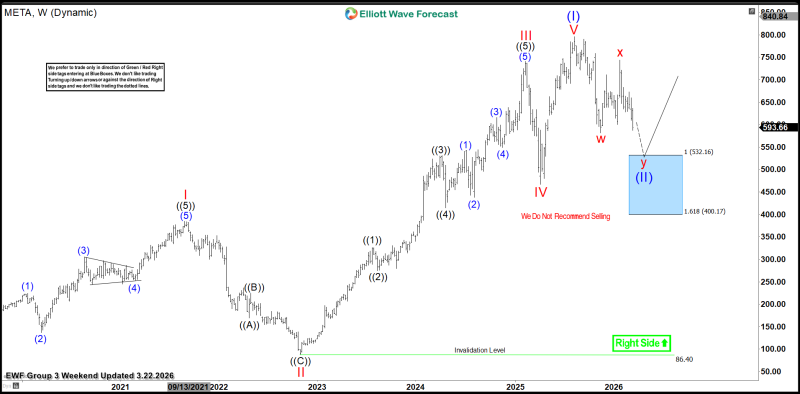
Wave Y appears to be nearing completion inside a defined Fibonacci zone between approximately $532 and $400. This area is marked directly on the chart as a high-probability buying region, where the broader correction may terminate.
A Larger META Stock Trend Still Intact Above $86 Invalidation Level
Despite the pullback, the broader structure remains constructive. The prior rally from 2023 into 2025 formed a clear impulsive sequence, suggesting that the current move is corrective rather than a trend reversal.
Price holding above the long-term invalidation level near $86 keeps the higher timeframe structure intact.
Price continues to hold well above the long-term invalidation level near $86, preserving the higher timeframe structure. Similar behavior has been observed in previous setups, including cases where META stock rebounds from key support zone, reinforcing how corrective phases often precede renewed upside.
Why the $400-$532 Fibonacci Zone Is Drawing Market Attention
The current zone stands out due to several overlapping technical factors:
- Completion of a 7-swing corrective pattern
- Entry into a defined Fibonacci support region ($400-$532)
- Corrective (non-impulsive) downside structure
- Chart annotation explicitly discouraging selling in this region
This type of setup aligns with earlier technical conditions where META stock signals trend shift after 5-wave decline, suggesting selling pressure may already be exhausted.
When corrective structure completes inside a defined Fibonacci zone, it creates the kind of setup where buyers historically begin to reassert control.
At the same time, broader positioning in META continues to reflect consolidation phases seen when META stock eyes $700 target near key moving averages, where compression typically precedes expansion.
The chart also projects a potential upward path following the completion of wave Y, indicating that if the structure holds, buyers may begin to regain control from this zone. For traders tracking META stock and broader S&P 500 leadership, this setup highlights a moment where corrective pressure may transition into the next directional phase.
 Usman Salis