 Saad Ullah

⬤ Meta Platforms (META) is trading in a technically important zone, hovering around $660–$670 as it tests both its 50-day and 200-day moving averages. The stock has bounced sharply from the mid-$500s and is now consolidating in a tighter range. This type of compression usually comes before a bigger move, and the chart shows buyers consistently stepping in during pullbacks rather than letting the price slide further.
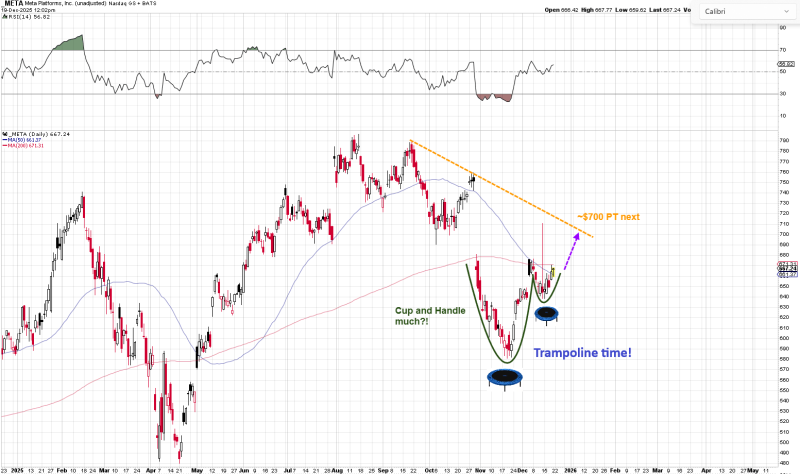
⬤ The technical picture shows what looks like a cup-and-handle formation taking shape. The handle is forming just above the 200-day moving average, while the 50-day moving average is acting as short-term support. As one analyst noted, "the setup resembles a coiled structure that often precedes directional expansion." This alignment of support levels suggests the market is getting ready for the next leg higher, with multiple tests of these zones holding firm.
⬤ Momentum indicators are showing stabilization rather than exhaustion. The RSI is sitting in the mid-range, which means recent gains haven't been driven by overheated buying. The stock has also held above its recent low near $595 and continues making higher lows heading into late December. If this support zone holds, the chart projects a potential move back toward the $700 level, where a descending trendline sits as the next major resistance.
⬤ META is now at a decision point that could influence sentiment across big-cap tech stocks. Holding above both moving averages would confirm the bullish structure and likely attract more buyers. Breaking below current support could delay any rally attempts. With price action tightening and key technical levels converging, the next move from META will likely set the tone for near-term momentum in the broader market.
 Saad Ullah


