 Saad Ullah

IREN stock is entering a fragile phase after an extended rally, with price action now reflecting fading momentum and increasing downside pressure. While the longer-term trend delivered a powerful upside run, the current structure suggests that control may be shifting - placing focus on a lower liquidity zone that could act as a magnet in the coming months. Analyst Peter DiCarlo has been tracking this setup closely, noting that after a year-plus bull cycle, this kind of structure often precedes a multi-month corrective phase rather than immediate continuation.
A Bull Cycle That Is Losing Strength
The chart clearly shows a strong prior uptrend, with IREN climbing aggressively and printing higher highs throughout the cycle. That structure defined a sustained bullish phase, with buyers consistently stepping in on pullbacks. However, that trend has now weakened.
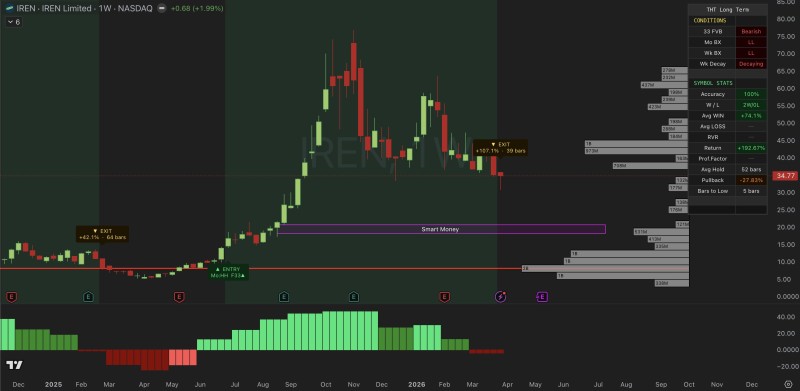
Recent price action shows a transition away from expansion and into a more unstable structure. Instead of continuation, the stock has begun forming lower highs, with rallies failing to regain prior strength. This shift aligns with broader technical observations, where IREN Stock Rejected at $40 Bull Market Support Band and momentum has since cooled considerably.
The $20 IREN Volume Gap Below Current Price
A key feature on the chart is the visible volume gap extending toward the $20 region. In technical analysis, these gaps often act as areas price revisits - especially when momentum turns negative. IREN is currently trading around the mid-$30s, already drifting lower from recent highs. The structure suggests that sellers are gradually gaining control, with no strong reversal signals appearing yet.
Once key support zones are lost, attention often shifts to lower levels where the next meaningful demand may appear.
The presence of this gap reinforces the idea that downside continuation remains a realistic path unless the structure changes. For context on how IREN lost key levels earlier in the move, IREN Limited Drops 11% Below Bull Support - $27 Zone in Focus captured that earlier breakdown in detail.
IREN Momentum Signals Turning Lower
Momentum on the chart has flipped bearish, with indicators turning red and continuing to expand. This reflects growing downside pressure rather than stabilization. Price action supports this reading:
- Lower highs forming after the peak
- Weak rebound attempts failing to build continuation
- Gradual drift lower without strong buying response
These signals suggest that buyers are not stepping in with conviction, leaving the stock vulnerable to further downside rotation.
A Setup Without Confirmation of Strength
Despite the sharp prior rally, the current setup lacks the key ingredient needed for a reversal: confirmation of demand. The chart does not show impulsive bullish moves, strong reclaim levels, or structural shifts back to higher highs. That absence is central to the current outlook.
The market is still transitioning out of a bullish phase and into a corrective one - until buyers return with clear strength, the path of least resistance remains lower.
While it is possible for IREN to reverse from current levels, the technical structure does not yet support that scenario. For those tracking the broader resistance picture, IREN Stock Tests $45 Resistance: Will Price Break Higher or Consolidate Further provides useful context on where upside barriers remain intact.
Until buyers return with clear strength, the $20 region stands out as a potential target rather than an unlikely extreme - a realistic destination given the current technical setup.
 Saad Ullah


